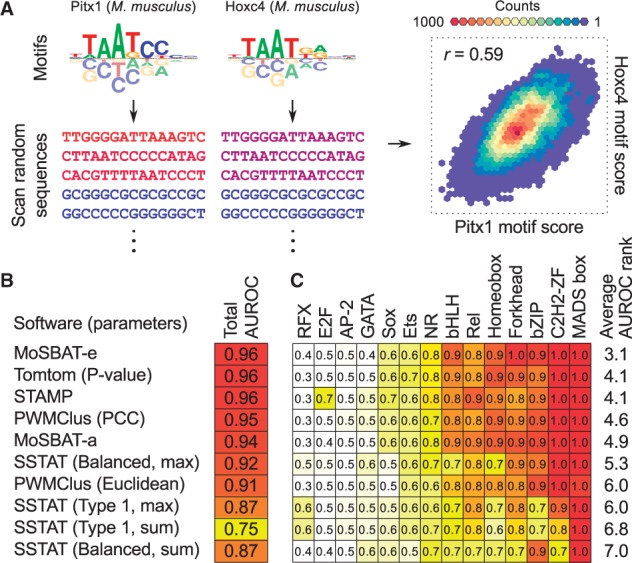
Fig. 1.

MoSBAT workflow and benchmarking results. (A) Schematic illustration of MoSBAT workflow. The sequence shades represent PSAM scores of sequences for each of the motifs, calculated as the sum of scanning scores for each sequence. (B) Benchmarking results for comparison of ChIP-seq versus in vitro motifs. The set of parameters used to run each method is indicated in parentheses; see original publications for explanation of the parameters. AUROC: area under ROC curve (C) AUROC values for ChIP versus in vitro comparison per TF structural class (Color version of this figure is available at Bioinformatics online.)
