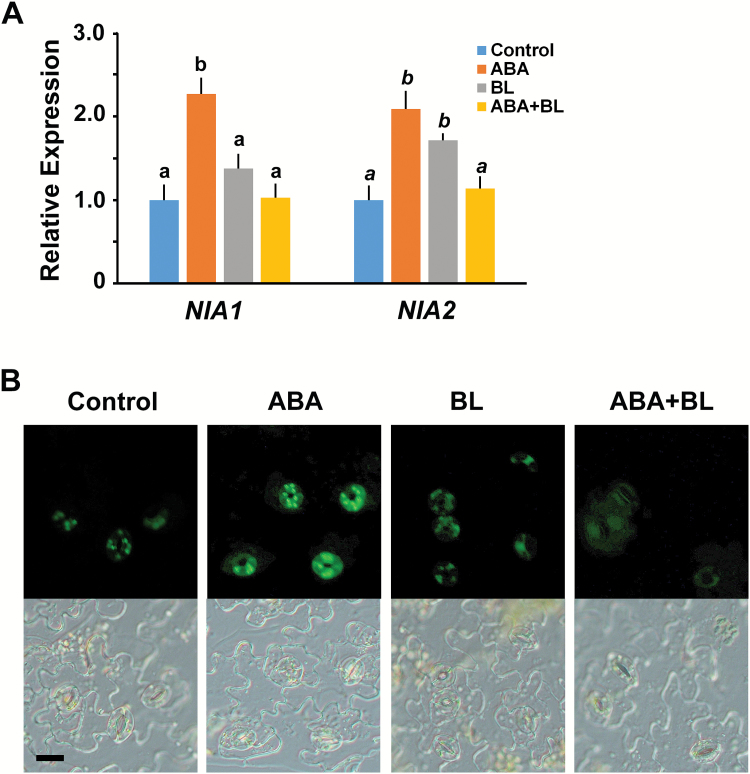
Fig. 5.
High concentrations of BL inhibited ABA-induced NO production. (A) Relative expression of NIA1 and NIA2 in response to ABA and BL alone, and in combination. qRT-PCR analyses were performed in triplicate using RNA isolated from 10-d-old wild type Col-0 seedlings. Data were normalized to the expression of ubiquitin. Experiments were independently repeated twice. Error bars indicate standard error. Values labeled with different letters (roman and italic, respectively) are statistically different analysed by one-way ANOVA (P<0.05). (B) NO production in response to each condition was detected by fluorescent DAF in the guard cells (upper panels). Lower panels show the bright field images corresponding to the same region of the epidermal tissues. Scale bar indicates 20 μm.

