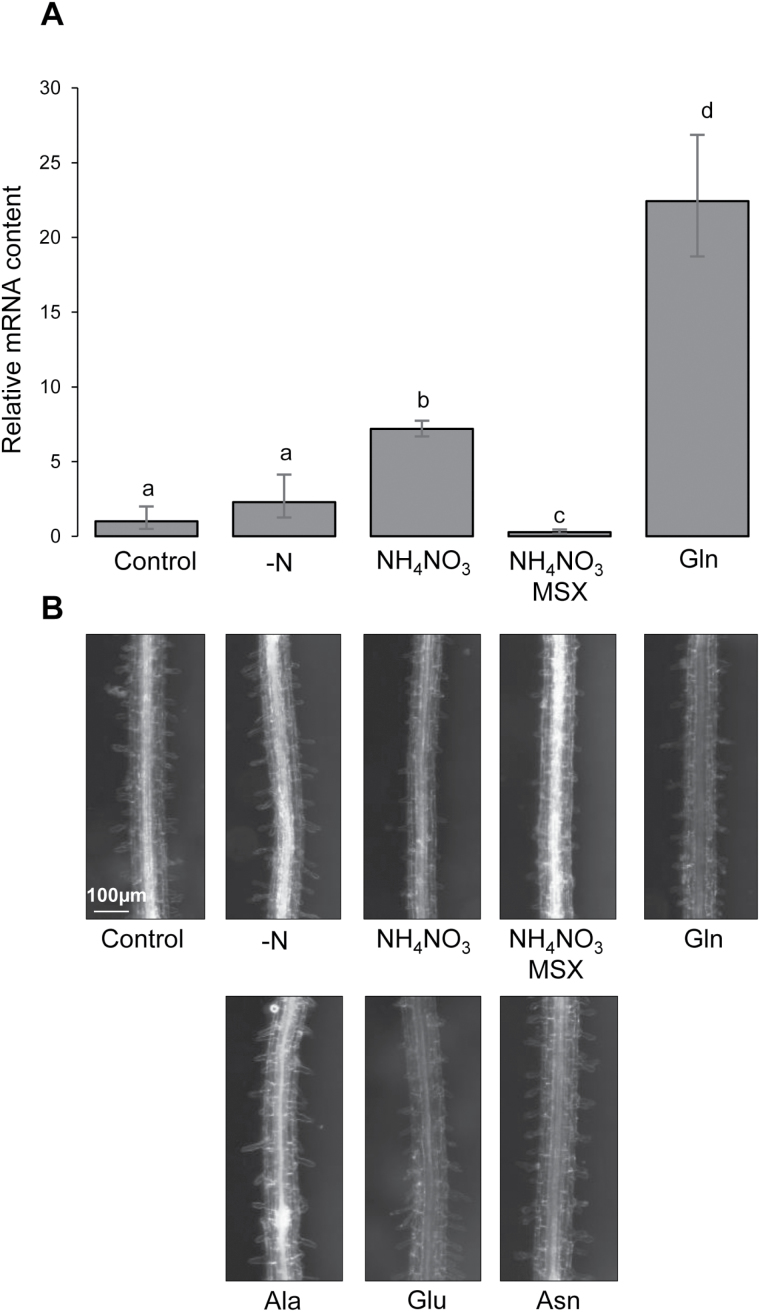
Fig. 4.
UMAMIT14 transcript levels in plants grown in different nitrogen conditions. Treatments are described in Supplementary Fig. S10. (A) UMAMIT14 mRNA levels were determined by qRT-PCR and normalized against ACTIN2 mRNA levels. Data show the fold-change relative to the non-treated control plants (Control). Error bars correspond to the standard deviation (n=3 biological replicates). Significant differences (P<0.05) are indicated by different letters according to one-way ANOVA in conjunction with Tukey’s test. (B) GUS activity in the roots of UMAMIT14 promoter–GUS plants subjected to the same treatments as in (A), and addition of Ala, Glu, and Asn (20, 20, and 10 mM, respectively). Results are shown from one representative GUS line among four that produced similar results. (This figure is available in colour at JXB online.)

