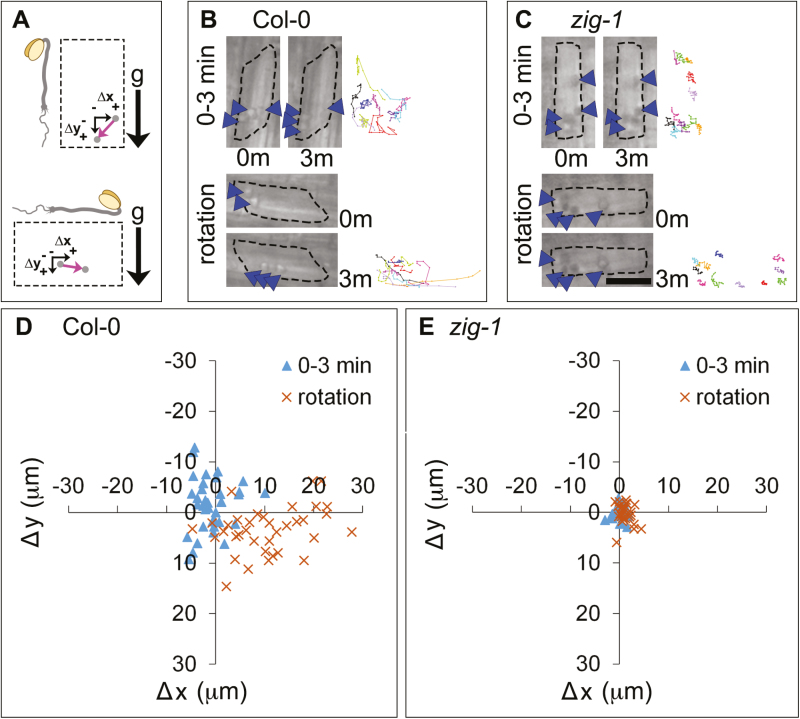
Fig. 2.
Amyloplast dynamics in hypocotyl endodermal cells before and after gravity reorientation. (A) Schematic representation of the rotation experiment. The orientation of the seedling with respect to gravity (g) before and after rotation is shown. Displacement of an amyloplast (gray circle) during a 3 min time lapse is shown with a pink arrow, and is expressed as a change in the horizontal position (Δx) and the vertical position (Δy). Positive values correspond to right and down and negative values correspond to left and up. (B, C) Amyloplast movements before and after rotation. A representative cell from the endodermis of Col-0 WT (B) or zig-1 (C) is shown before (0–3 min) or after (rotation) a 90° rotation. Images correspond to the amyloplast positions at the start (0m) or the end (3m) of a 3 min time lapse. Tracks of representative amyloplasts are shown as different colored lines at the right of each panel. Arrowheads indicate one to two amyloplasts. Scale bar: 15 μm. (D, E) Quantification of amyloplast movements in WT and zig-1 before and after rotation. Coordinate graph showing amyloplast displacement between 0 and 3 min in Col-0 WT (D) or zig-1 (E). Time-lapse experiments were carried out either before (blue triangles) or after (orange crosses) a 90° rotation. n=73 amyloplasts from four seedlings of Col-0; n=65 amyloplasts from four seedlings of zig-1.

