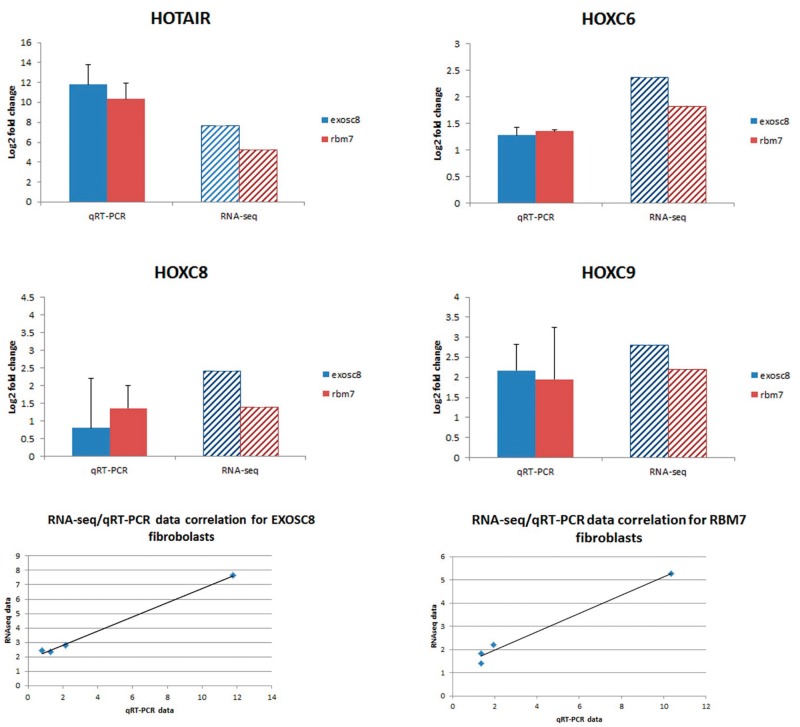
Figure 3.
Gene expression analysis of four genes through qRT-PCR confirmed RNA-seq data. RNA-seq data and qRT-PCR show a high correlation. The qRT-PCR data show relative expression of target genes in RBM7 and EXOSC8 mutant fibroblasts compared with control fibroblasts. Analysis was repeated on three biological replicates.

