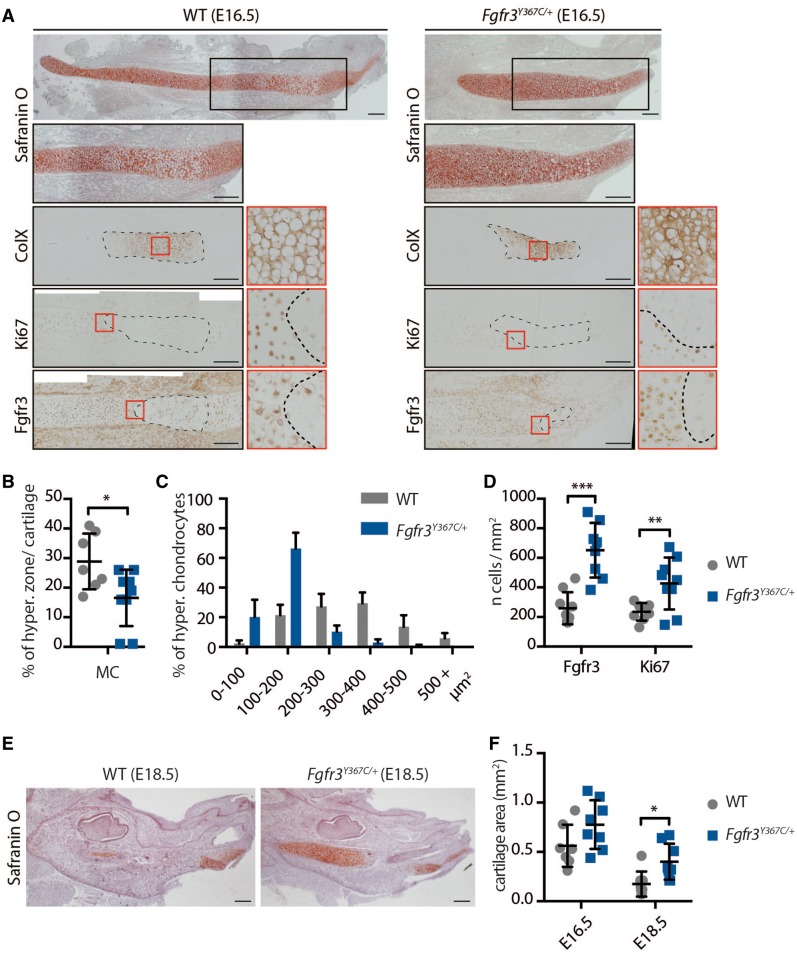
Figure 2.
Chondrocytes homeostasis is disturbed in Meckel’s cartilage of Fgfr3Y367C/+ mice. (A) Histological staining (Safranin’O) and immunostaining for Collagen X, Ki67 (proliferation marker) and Fgfr3 of MC of WT and Fgfr3Y367C/+ E16.5 embryos. An enlargement of the ColX immunostaining (red box) highlights the modification in the size of hypertrophic chondrocytes in Fgfr3Y367C/+ embryos (scale bar = 200 μm). Area delimited with doted lines on the ColX panel corresponds to the hyperthrophic zone. Areas delimited with doted lines on the Ki67 and Fgfr3 panels correspond to immunonegative zones (respectively non-proliferative and Fgfr3-negative). Enlargements of the Ki67 and Fgfr3 immunostainings (red box) highlight the limits of the positive and negative zones. (B) Measurement of the ColX positive zone inside MC of WT and Fgfr3Y367C/+ E16.5 embryos (n ≥ 7 individuals for each genotype). (C) Mean percentage of hypertrophic chondrocytes for different size categories (expressed in μm2) inside MC of WT and Fgfr3Y367C/+ E16.5 embryos (n ≥ 50 cells from n ≥ 6 individuals for each genotype). (D) Mean number of immuno-positive cells for Fgfr3 or Ki67 inside MC of WT and Fgfr3Y367C/+ E16.5 embryos (n ≥ 7 individuals for each genotype). (E) Histological staining (Safranin’O) of WT and Fgfr3Y367C/+ E18.5 embryos (scale bar = 200 μm). (F) Mean cartilage area, measured on sagittal sections of MC in WT and Fgfr3Y367C/+ E16.5 and E18.5 embryos (n ≥ 7 individuals for each age and genotype). Data shown as mean with SD; *P < 0.05, **P < 0.01, ***P < 0.005.

