Figure 4.
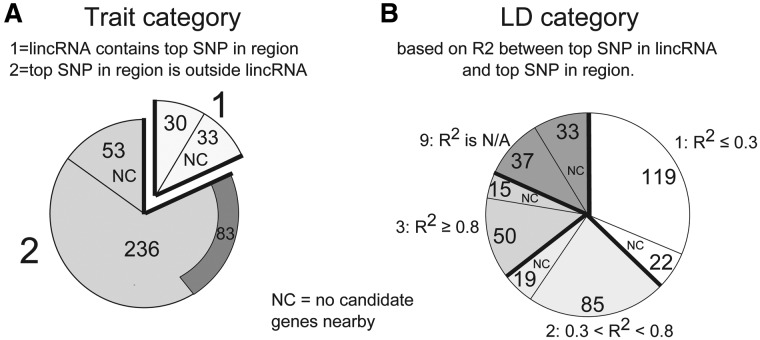
Distribution of lincRNAs across trait categories and LD categories. Counts of lincRNAs in different Trait and LD Categories are shown. The proportion of lincRNAs within each category that had no candidates in the region is indicated by ‘NC’. (A) Trait category. Sixty-three lincRNAs were assigned trait category 1, indicating that they contained the strongest SNP in their 1 MB region. Of the 236 lincRNAs that did not contain the strongest SNP in the region and did have candidate genes nearby, 83 still had a stronger SNP than their neighboring candidate genes, indicated by the dark arc. (B) LD category is based on the LD between the top SNP in the lincRNA and the top SNP in the region. The 63 lincRNAs that already contained the top SNP in the region were placed in LD category 9. The remaining lincRNAs were placed in either category 1, 2 or 3 depending on the R2 value, with about half showing low LD (R2 ≤ 0.3) with the top SNP in the region, suggesting that the lincRNA may contain an independent signal.

