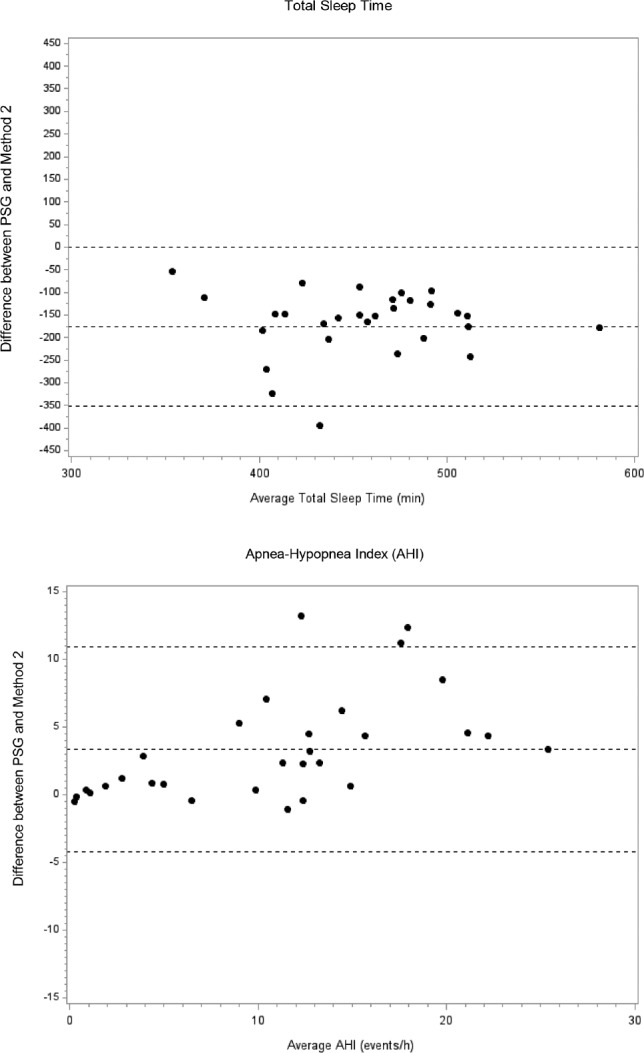
Figure 2. Bland-Altman plots showing the difference between PSG and method 2 (using total recording time) for total sleep time and the AHI.

Lines represent the mean bias and the two standard deviations of the difference. PSG = polysomnography, AHI = apnea-hypopnea index.
