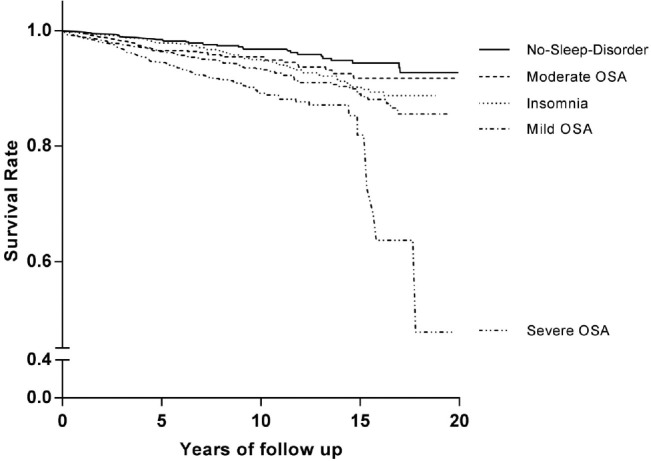
Figure 1. Kaplan-Meier survival curves for all-cause mortality.

Kaplan-Meier estimated survival rate for all-cause mortality according to OSA severity and insomnia. The survival rate was significantly lower in the severe OSA group that in all other groups (p = 0.001). The mild OSA and insomnia groups had lower survival rates than the no-sleep-disorder group (p < 0.001 and p = 0.02, respectively). The survival rate did not significantly differ between the moderate OSA group and the no-sleep-disorder group. OSA = obstructive sleep apnea.
