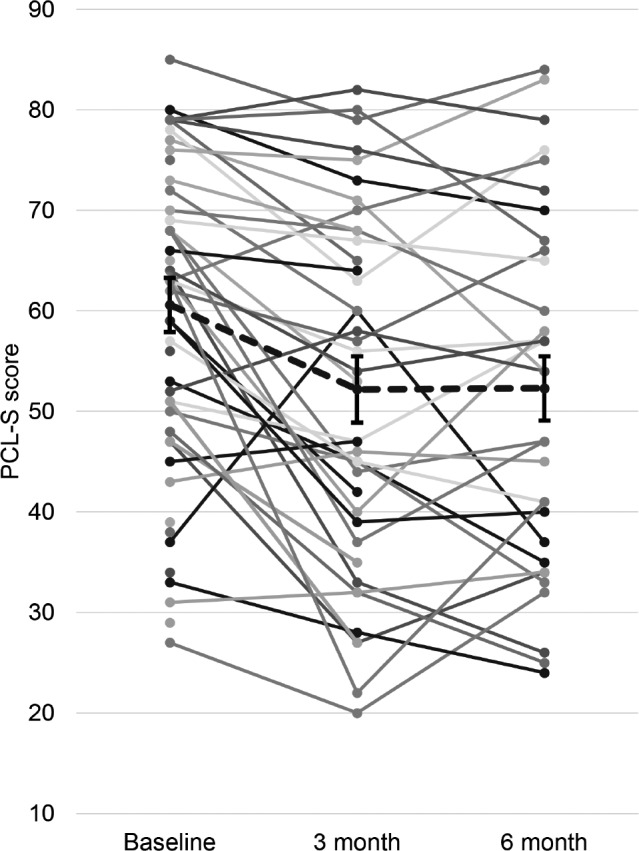
Figure 2. For the final cohort (n = 32) PCL-S scores decreased significantly across baseline, 3 months, and 6 months follow up (p < 0.001 for the trend by ANOVA).

Mean score (dotted line) decreased from baseline to 3 months (60.6 versus 52.2 points; p < 0.001) but did not change significantly from 3 months to 6 months (52.2 versus 52.3; p = 0.95). Graph includes all subjects (n = 59) denoted as solid dots and lines, including those with only baseline (n = 18) or 3 month follow up (n = 9) for illustrative purposes.
