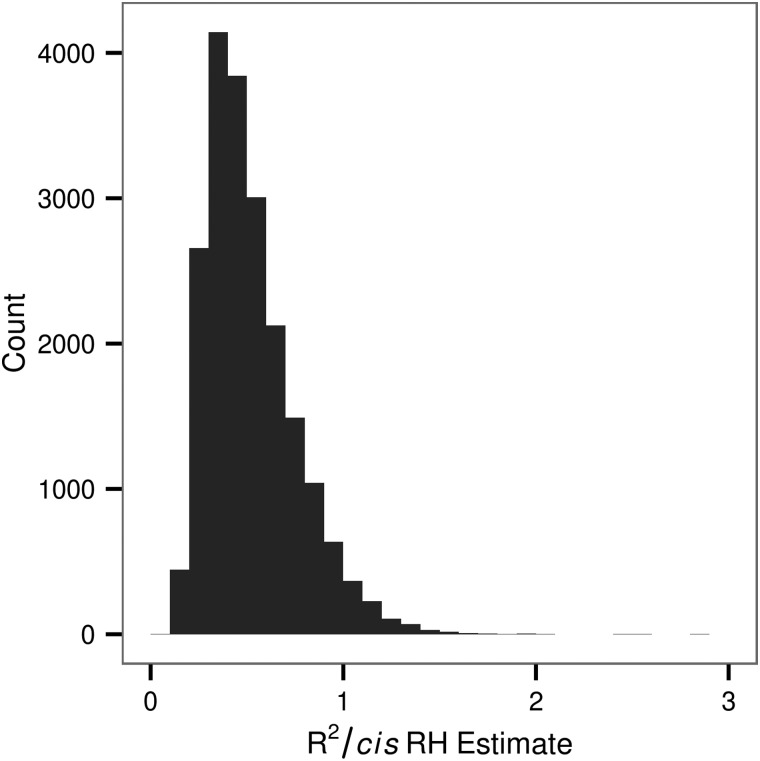
Figure 10.
Proportion of the regional heritability that can be explained by the top SNP association. The variance explained by a SNP (R2) divided by the regional heritability estimate for DNAm sites with a regional heritability estimate significant at P < 0.05. Only the most significant SNP within the local region was considered. In 4.2% of cases the SNP explained more variance in the DNAm level than did the region.

