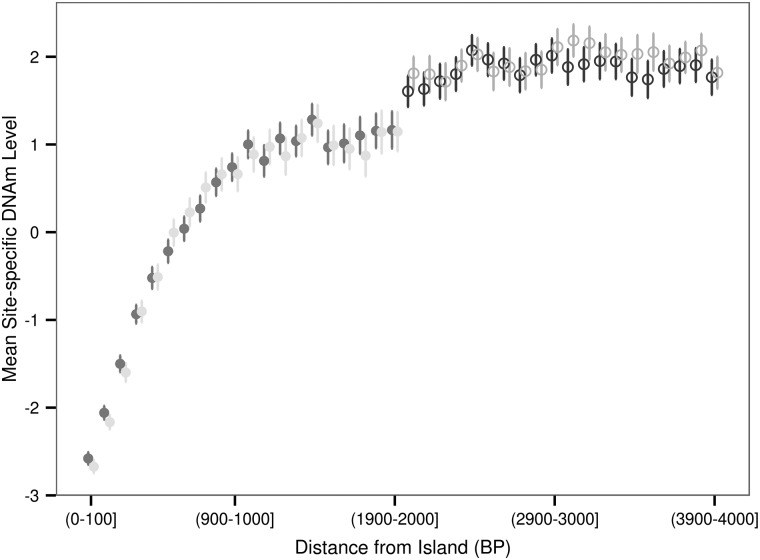
Figure 2.
Mean site-specific DNAm level as a function of distance from the edge of the island. The 4000 BP region upstream (North) and downstream (South) of islands was divided into bins of 100 BP. The average of the mean site-specific DNAm levels for DNAm sites residing within each bin is shown as a circle enclosed by a line indicating ±2 standard error of the mean estimate. A shore is up to 2000 BP from an island and a shelf is between 2000 and 4000BP from an island.

