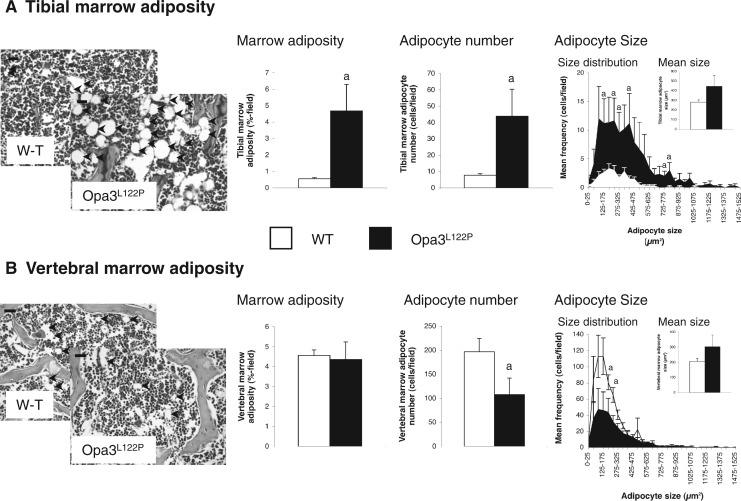
Figure 4.
Opa3L122P mice show site-specific dysregulation of marrow adiposity. Digital analysis of photomicrographs (inset; (adipocytes: black arrows); scale bar 20 µm (tibial images) 50 µm (vertebral images)) to quantify marrow adiposity, adipocyte number, adipocyte size and size distribution in tibiae (A) and L3 vertebrae (B) from 30-day-old male WT (n = 6 (tibiae) and 5 (vertebrae)) and homozygous Opa3L122P littermate mice (n = 6 (tibiae) and 3 (vertebrae)). Data presented are mean ± SEM, with statistical analysis performed by unpaired Student’s t test; a P < 0.05 versus WT males.

