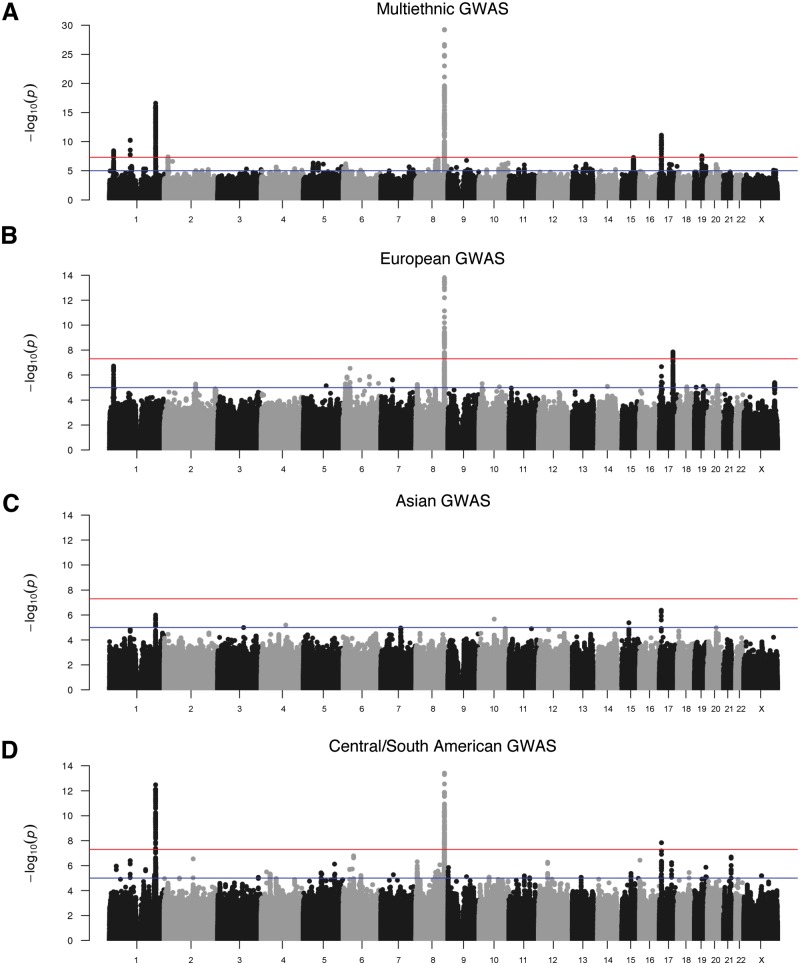
Figure 1.
Manhattan plots of –log10(P-values) from meta-analysis of case–control and TDT results in a multiethnic CL/P cohort. Results are shown for the combined multiethnic sample (A) and groups with (B) European ancestry, (C) Asian ancestry and (D) Central and South American ancestry. Colored lines denote suggestive (blue) and genome-wide (red) thresholds for significance. The genomic inflation factors, λ, are 1.088, 1.01, 0.979 and 1.045, for the multiethnic, European, Asian and Central/South American scans, respectively, indicating minor inflation in p-values consistent with the observation of multiple strongly associated loci.

