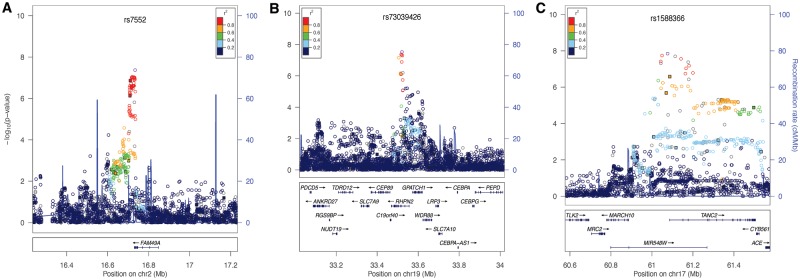
Figure 2.
Regional association plots showing –log10(P-values) for genotyped (filled squares) and imputed (open circles) SNPs for novel genome-wide significant peaks. (A) Results at the 2p24 locus from the meta-analysis in the multi-ethnic cohort. (B) Results at the 19q13 locus from the meta-analysis in the multiethnic cohort. (C) Results at the 17q23 locus from meta-analysis in the European ancestry group. Plots were generated using LocusZoom (52). The recombination overlay (blue line, right y-axis) indicates the boundaries of the LD block. Points are color coded according to pairwise LD (r2) with the index SNP.

