Figure 2.
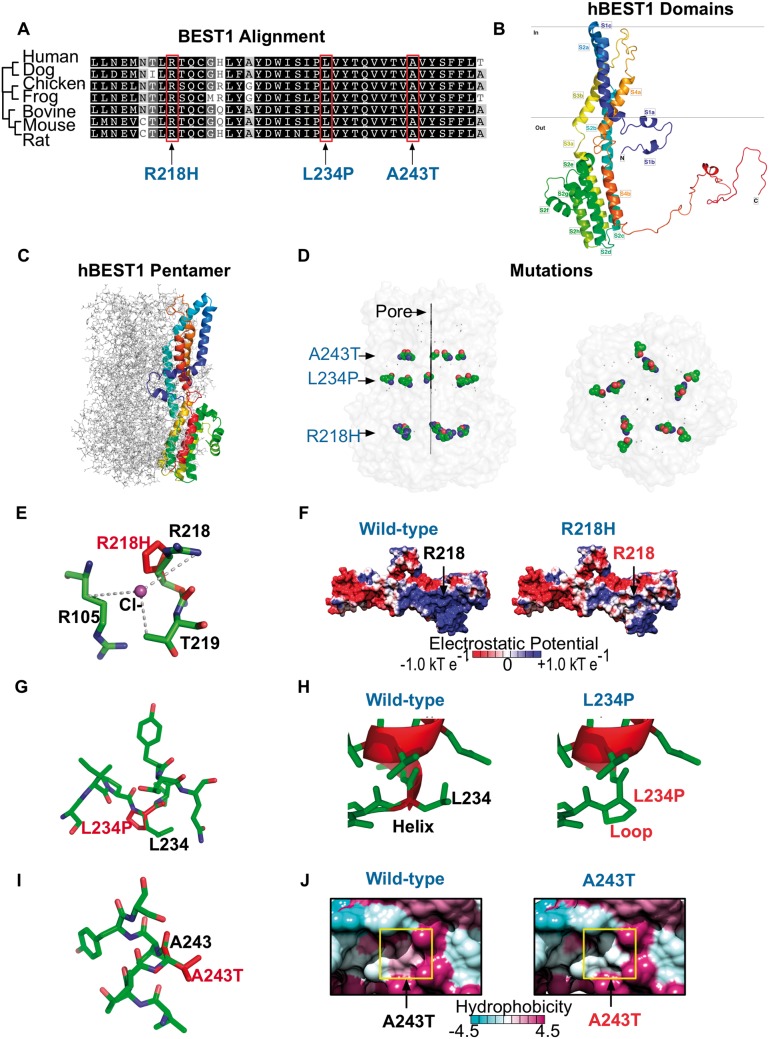
Modeling of VMD mutations on human bestrophin-1 structure. (A) Species sequence alignments of BEST1 shows that the patient VMD mutations fell on conserved residues. (B) Homology model of hBEST1 generated using cBEST1 (PDB: 4RDQ) as a template. (C) Superimposition of the hBEST1 monomer on the channel pentamer. (D) Location of the patient VMD mutations in relationship to the channel pore. (E) Visualization of the putative Cl−-binding site in hBEST1 formed by the interface of R105, R218 and T219. The R218H mutation disrupts this binding site. (F) Electrostatic potential surfaces of the WT hBEST1 monomer and R218H hBEST1 reveal a change in positive to neutral potential in the residues surrounding the mutation. (G) Visualization of the location of L234P mutation in hBEST1. (H) Substitution of L234 with a proline would disrupt the secondary structure of the channel pore. Red represents helical residues while green represents residues that form disordered loops.(I) Visualization of the location of A243T mutation in hBEST1. (J) Hydrophobicity surface representations of the WT hBEST1 monomer and A243T mutant reveal a substitution of a hydrophobic residue to an uncharged, polar amino acid in a helix that is partially embedded in the membrane. The color scheme for the surface hydrophobicity is based on the Kyte and Doolittle scale.

