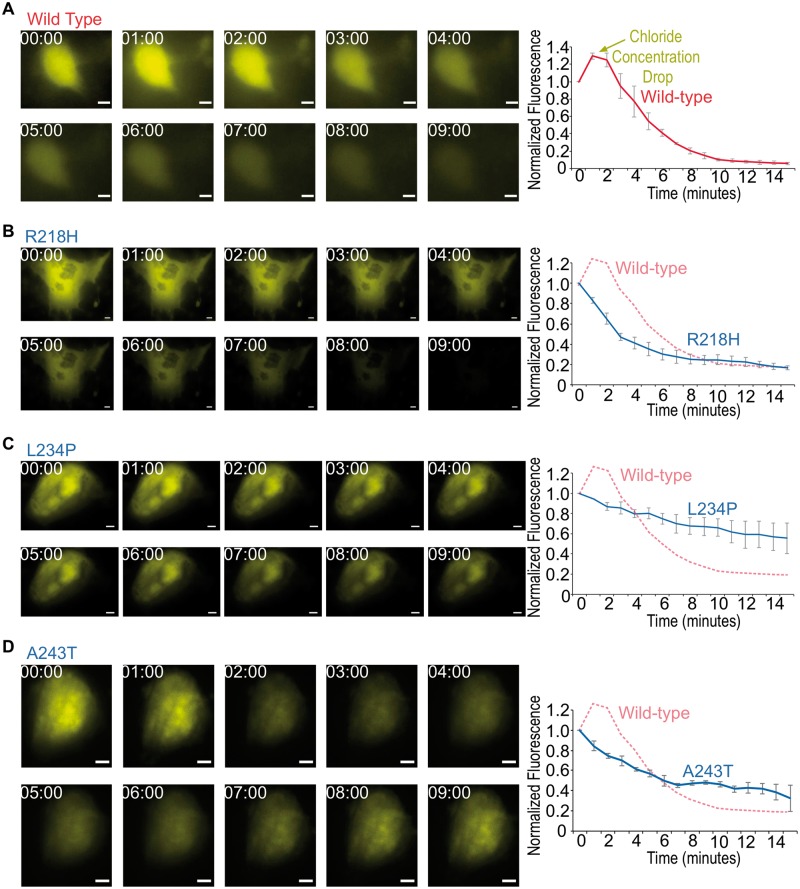
Figure 3.
Defective Cl− export in patient-specific iRPE revealed by biosensor imaging following calcium release. Representative still images of WT (A), R218H (B), L234P (C) and A243T (D) patient-derived RPE cells expressing Cl− biosensor and stimulated with 5 μM A23187 (left panels). Images were acquired at the given time in minutes after stimulation. Quantification of mean whole-cell biosensor emission intensity, normalized to t = 0 time point (right graphs). Data are represented as mean ± Standard error of the mean. Scale bar = 5 μm.

