Figure 9.
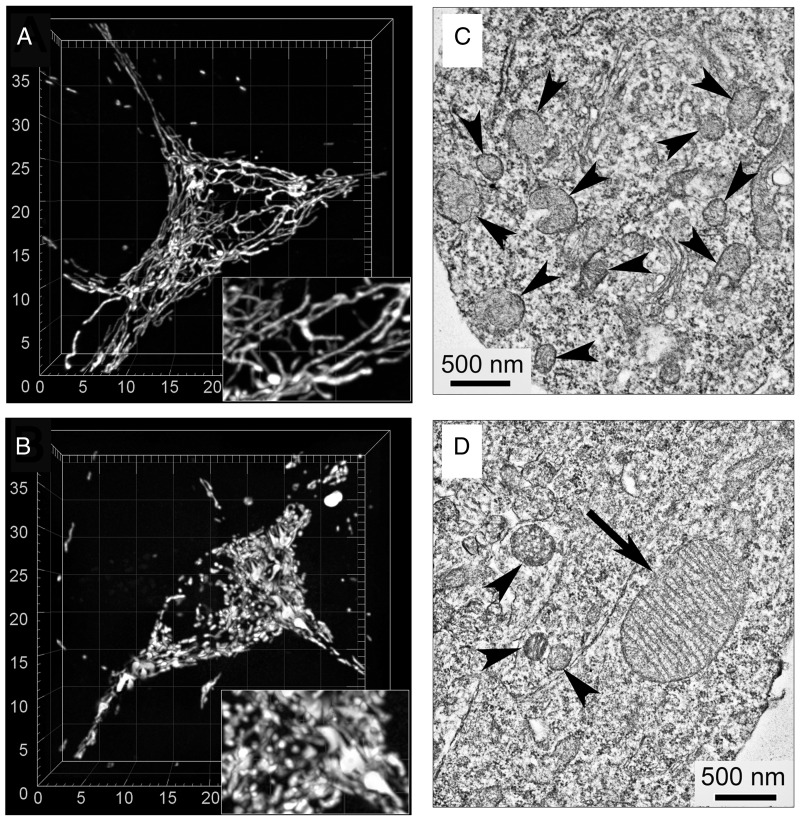
Representative 3D reconstructions of mitochondrial networks and electron micrographs of cultured striatal neurons from WT (A, C) and R6/2 (B, D) mice. In A and B, the representative 3D maximal fluorescence intensity projection images of the mitochondrial network in live cultured striatal neurons (9 DIV) from WT and R6/2 mice, respectively (total number of neurons analyzed in these experiments—142 neurons from WT mice and 148 neurons from R6/2 mice). Cells were analyzed in a blind manner. The scales are in µm. In C and D, representative electron micrographs of cultured striatal neurons (9 DIV) from WT and R6/2 mice, respectively. Arrowheads point to small-size, normal-looking mitochondria; the arrow points to enlarged mitochondrion.

