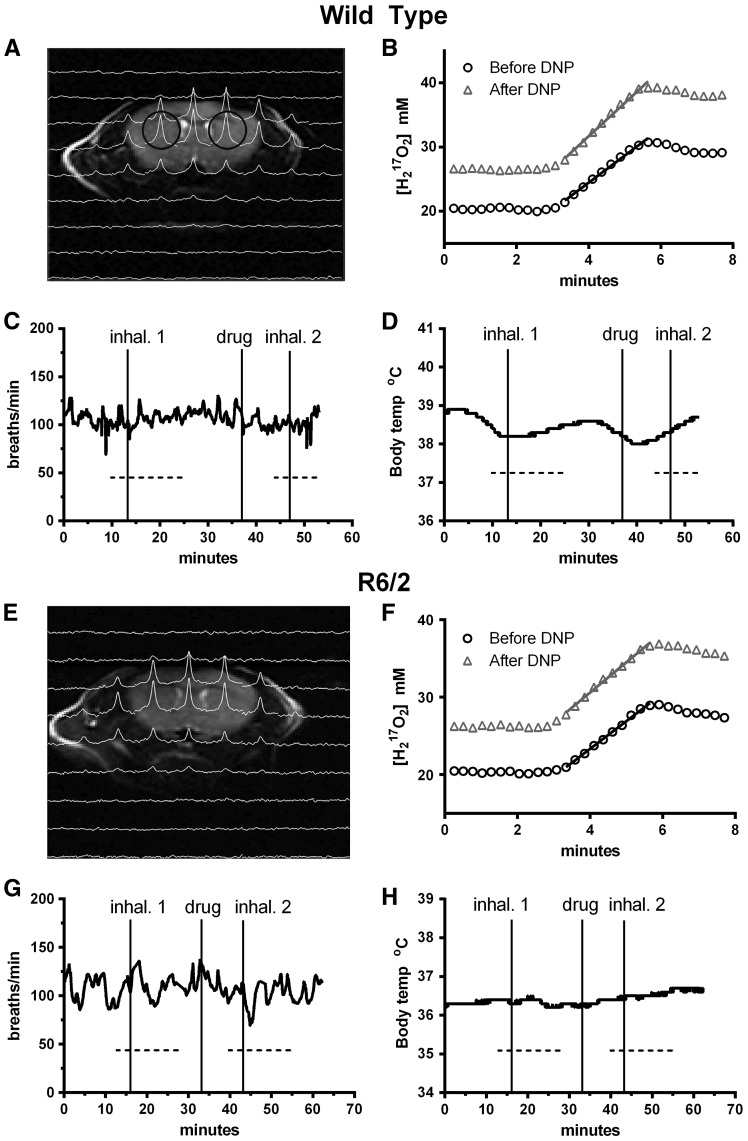
Figure 2.
Example 17O2 MRS data and mouse physiology used for CMRO2 calculations for a wild type (A–D) and an R6/2 (E–H) mouse. (A, E) 1H T2 weighted coronal images overlaid with the corresponding slice of 17O 3D CSI image, 1.5 min into the first 2.5 min inhalation. Voxels are indicated by black circles. (B, F) 17O signal from the right striatum during first (circles) baseline inhalation and second (triangles) inhalation after injection of DNP. Signal slopes during the inhalation indicated rate of oxygen consumption. During MRS scanning (dotted lines), breathing rate (C, G) and body temperature (D, H) remained stable.

