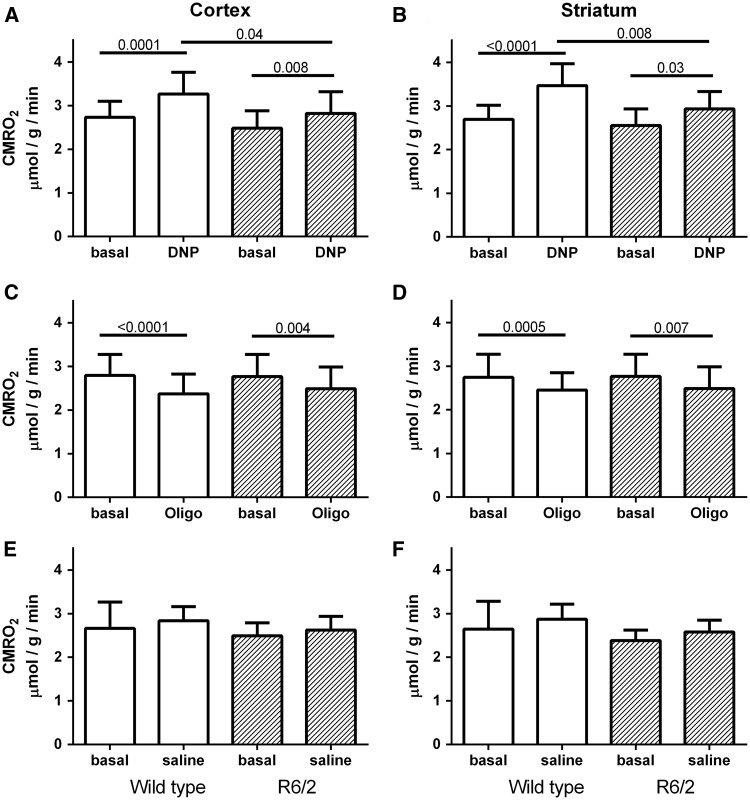
Figure 3.
Summary of CMRO2 data from wild type (white) and R6/2 (hatched) cortex (left column) and striatum (right column). (A, B) DNP injection significantly increased CMRO2 in both regions of all mice, but the increase in R6/2 (hatched) was less than in wild type (white) mice. (C, D) Oligomycin injection decreased the CMRO2 in striatum and cortex of both R6/2 (hatched) and wild type (white) mice. No differences were observed between R6/2 and WT mice in either region. (E, F) No differences in CMRO2 were observed between regions or genotype when saline was injected prior to the second 17O2 inhalation. Data are mean + SD. N = 10–11 for A, B. N = 3–5 for E, F. P values appear above lines indicating significant comparisons.

