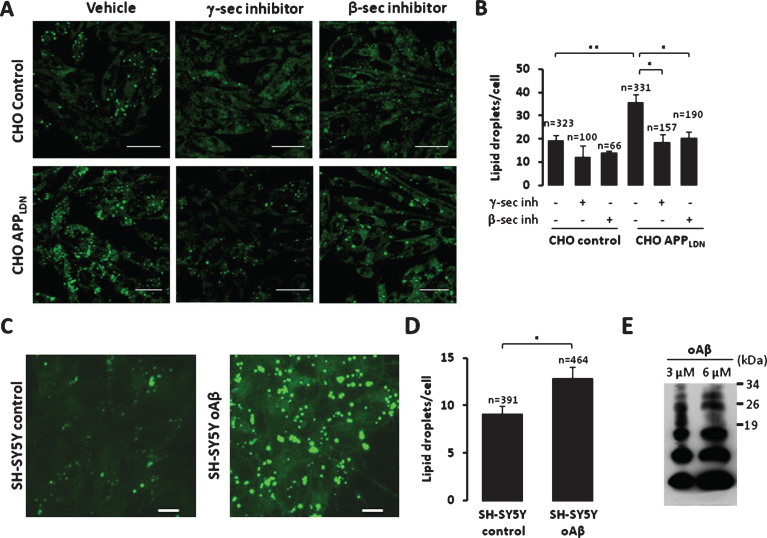
Fig.5.
Increased neutral lipid droplets accumulation in CHO cells expressing APPLDN. A) Representative images showing neutral lipids staining in CHO control cells or expressing APPLDN. Cells were treated with vehicle or with β- or γ-secretase inhibitors for 20 h. Scale bars represent 25 μm. B) The graph shows the quantification of lipid droplets (mean±S.E.M. number of puncta/cell). The number of analyzed cells is indicated for each condition and was obtained from at least three independent experiments. *p value < 0.05, and **p value < 0.01 using ANOVA one way and Tukey post-test. C) Representative images showing neutral lipids staining in SH-SY5Y cells non treated or treated with 5 μM oligomeric Aβ (oAβ) preparation for 20 h. Scale bars represent 10 μm. D) The graph shows the quantification of lipid droplets (mean±S.E.M. number of puncta/cell). The number of analyzed cells is indicated for each condition and was obtained from two independent experiments. *p value < 0.05, using Student t-test. E) Representative SDS-PAGE of oligomeric Aβ (3 μM and 6 μM) preparation.

