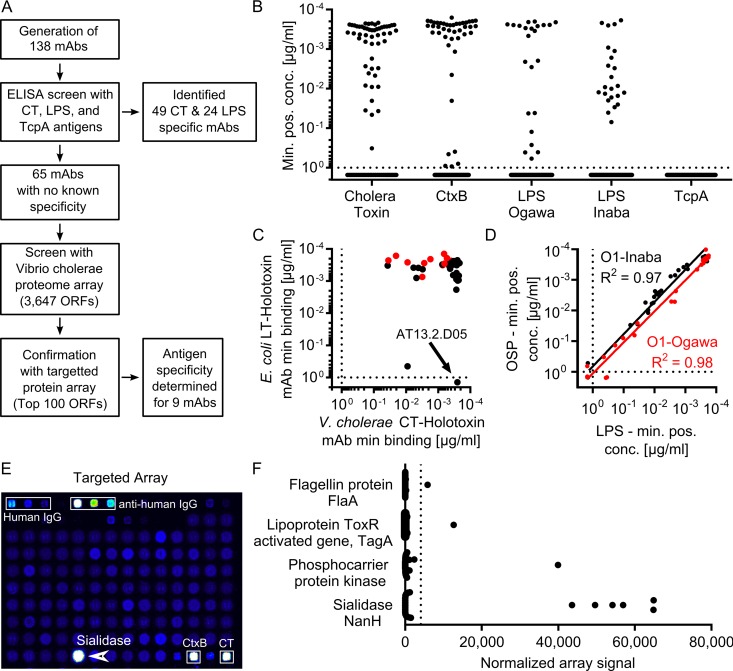
FIG 2 .
The majority of MAbs isolated from infected patients are specific for cholera toxin, LPS, or sialidase. (A) Flow chart describing experimental evaluation of MAb specificity. Antibodies were initially tested using an ELISA to assess binding to cholera toxin, LPS, and TcpA. Antibodies that did not bind to these antigens were subsequently examined using a novel V. cholerae proteome array. (B) Minimal binding concentrations to known V. cholerae antigens. Each antibody was measured in at least two independent experiments by ELISA to recombinant cholera holotoxin, recombinant CtxB, LPS derived from V. cholerae O1 serotypes Ogawa and Inaba, and TcpA. Values plotted represent average minimal effective concentrations, determined as the minimum MAb concentration required for 3 times the background signal of sample dilution buffer. (C) The minimal effective concentration for binding to CT holotoxin (x axis) and LT holotoxin (y axis). (D) An XY scatter plot shows the average minimum positive concentration for binding to OSP (y axis) and LPS (x axis) for serotypes O1-Ogawa (red) and O1-Inaba (black) as determined by two independent ELISA experiments. Solid lines represent the best-fit linear regression line of log-transformed values for each serotype. Dotted lines represent the maximal concentration tested for each MAb. (E) Representative data output showing the targeted array. (F) Summary of all the MAbs with unknown specificity as evaluated by the targeted miniarray. The dotted line represents a threshold signal set at 10 times the array signal intensity range of an isotype control antibody (EM4C04, influenza virus hemagglutinin [HA]-specific IgG1). Only antigens with at least one binding MAb are shown.

