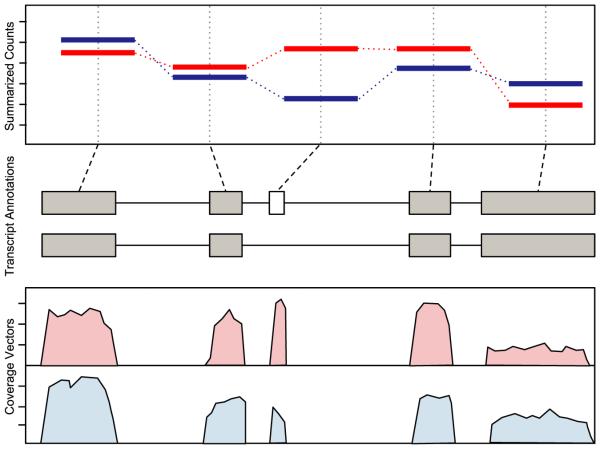
Fig. 1.
Cartoon visualization of all three types of genomic data: genome-length vectors, ranged, features and summaries (from bottom to top). Data from two samples are compared (red vs. blue). The bottom plot displays the coverage, a genome-length vector. The exon ranges are shown in the middle. The top plot presents summaries, the per-exon read counts.

