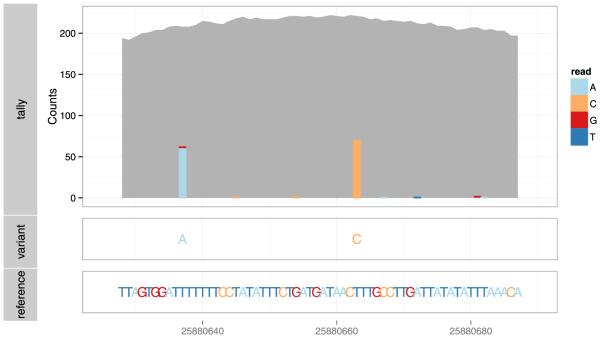
Fig. 5.
Example plot for diagnosing genotype calls, consisting of the nucleotide tallies, genotype calls and reference sequence, from top to bottom. The plot is dynamically generated for the selected region of interest, without processing the entire genome. The viewer might check to see if the tallies support the called genotypes. In this case, the data are consistent.

