
Figure 10.
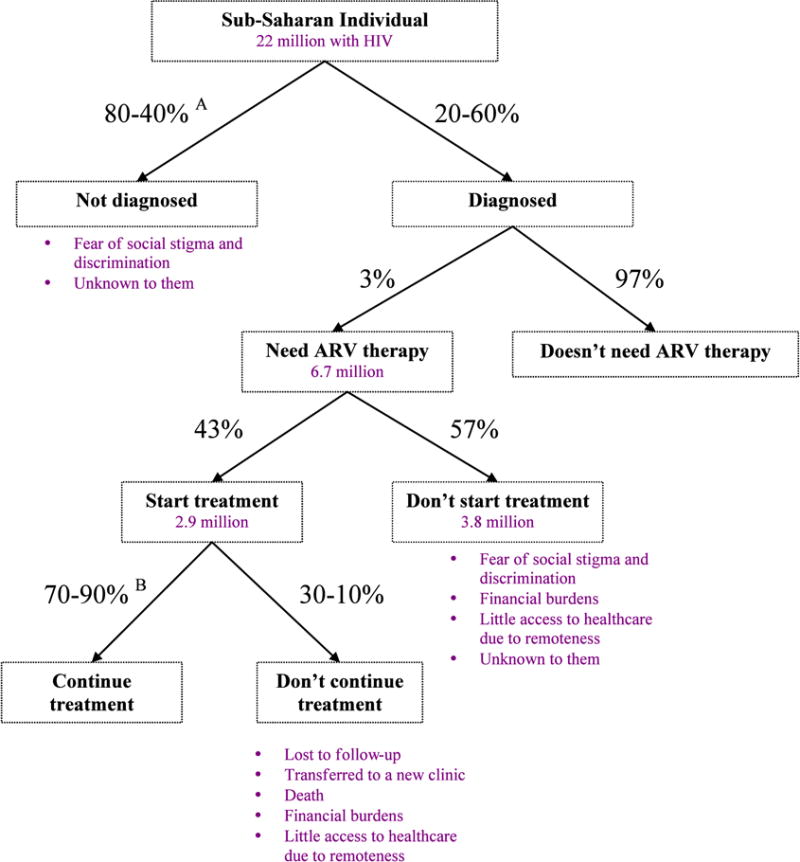
Possible choices and outcomes for HIV-related decisions in sub-Saharan Africa. Percentages are based on averages in sub-Saharan Africa, 2008. Source: WHO, Towards Universal Access, Progress Report 2009.
A Actual percentages depend on which sub-Saharan country; based on a 2007 survey.
B Percentage of patients that are still on ART after 12 months at the same clinic; over two-thirds of sub-Saharan countries report these values.