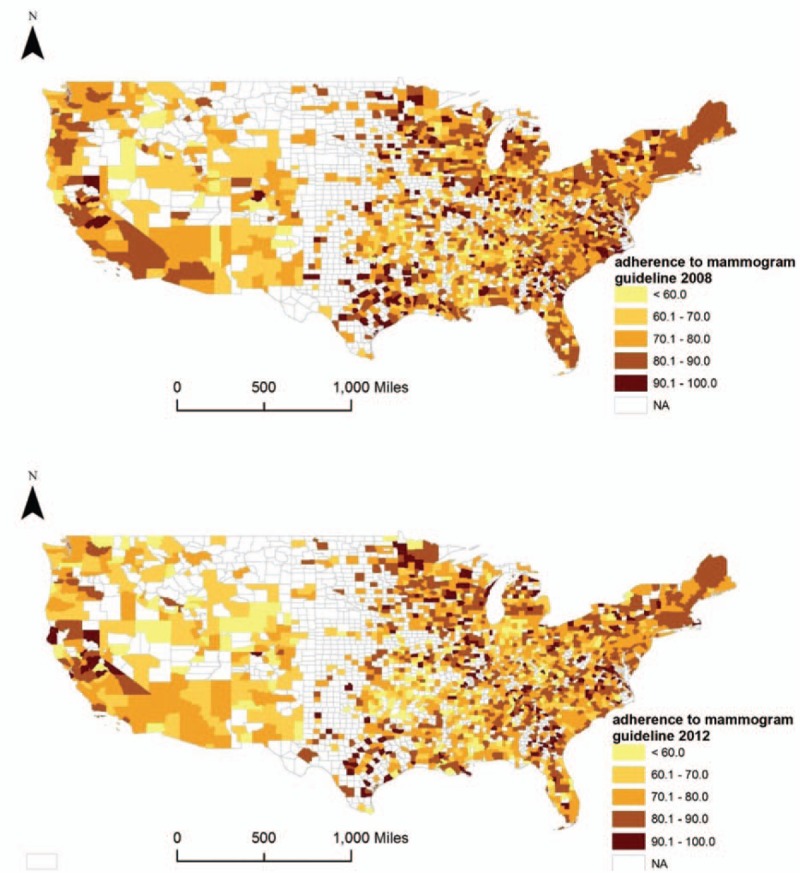
Figure 1.

County-level adherence to mammography screening guideline in 2008 and 2012. The choropleth maps illustrate the county-level adherence to mammography screening guideline in 2008 and 2012, using cut-off points at 60%, 70%, 80%, and 90%. Counties with missing values or excluded are filled with white color.
