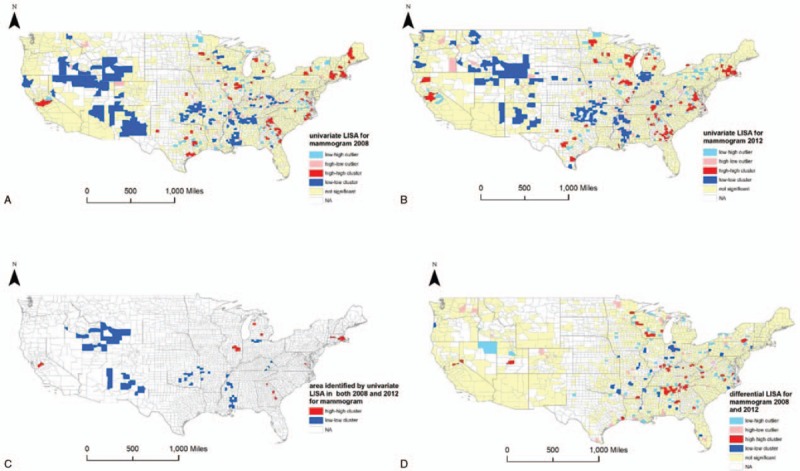
Figure 2.

Results of local indicators for spatial analyses for mammography screening. A, Results of univariate local indicators for spatial analyses (LISA), which illustrate the spatial patterns of adherence to mammography screening guidelines in 2008, are shown. B, Results of univariate LISA for adherence to mammography screening guidelines in 2012 are shown. C, Maps the clusters that indicate consistently low or high adherence to mammography screening guidelines. D, Results of differential LISA that depict the spatial autocorrelation on the change of adherence from 2008 to 2012.
