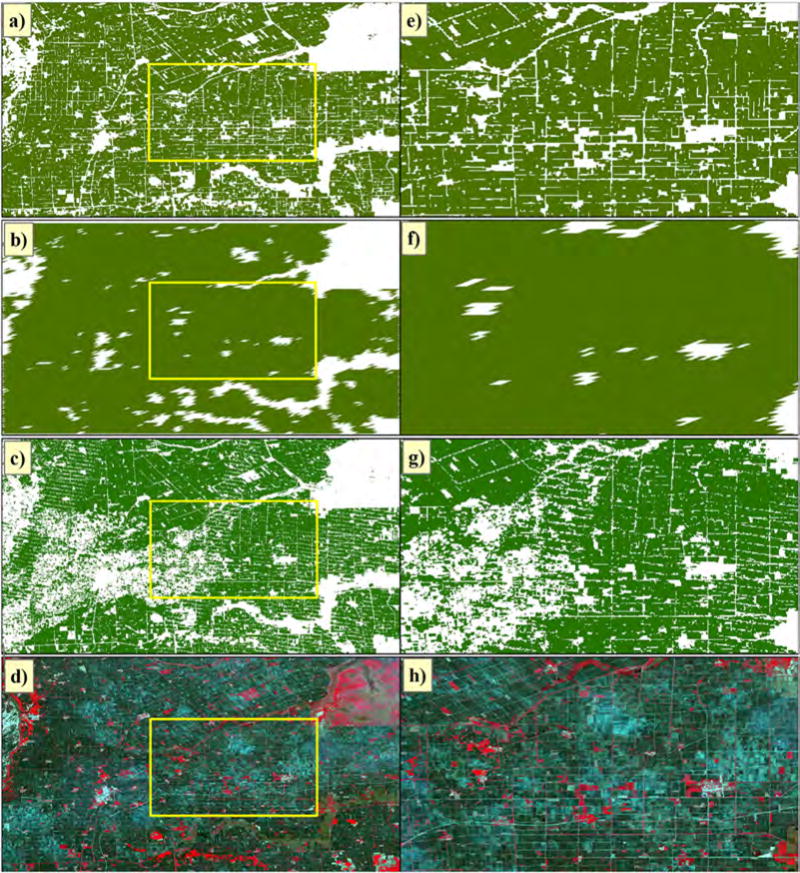
Fig. 8.

Comparison between Landsat 8-based 30-m paddy rice map, Landsat 7-based 30-m paddy rice map, and MODIS-based 500-m paddy rice map in 2014 in a typical paddy rice cropping region (the extent is marked in Fig. 7 Map 1) in Sanjiang Plain, NE China: a) 30-m Landsat 8-based result, b) 500-m MODIS-based result, c) 30-m Landsat 7-based result, and d) Landsat color composite image acquired on June 1, 2014. Maps e, f, g and h showcase the spatial details of a–d within the yellow box. (For interpretation of the references to color in this figure legend, the reader is referred to the web version of this article.)
