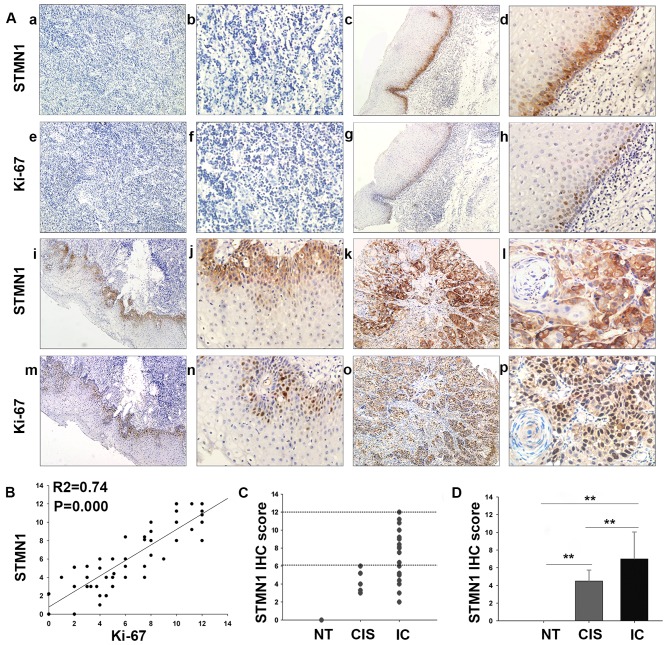
Figure 1.
Expression of STMN1 and Ki-67 in HSCC or normal tissues. (A) STMN1 versus Ki-67 was differentially expressed between HSCC and normal tissues as proved by immunohistochemical staining. (a and b) Negative STMN1; (c and d) weak STMN1; (e and f) negative Ki-67; (g and h) weak Ki-67; (i and j) moderate STMN1; (k and l) strong STMN1; (m and n) moderate Ki-67; (o and p) strong Ki-67 expression in normal tissue (NT), cancer in situ (CIS), early invasive tumor and advanced tumor, respectively (magnification, ×100 and ×400). (B) Scatterplot of Ki-67 versus STMN1 with regression line showed a correlation using the Spearman's correlation coefficient (R2=0.74, P=0.000). (C and D) Distribution of STMN1 IHC score in samples. *P<0.05, **P<0.01, statistically significant. Data were expressed as the mean ± SD.

