
Fig. 1. Sensitive detection of C6 glioma cells.
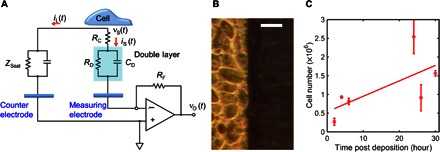
(A) Equivalent circuit model. (B) Photograph of glioma cells. The bright part denotes cells on top of the Au electrode; the darker region indicates the cells outside the Au electrode. Scale bar, 60 μm. (C) Cell number as a function of time after cell deposition. For all measurements, the average cell viability was 79% (±12%). Each data point was repeated five times. The straight diagonal line represents a guide to the eye.