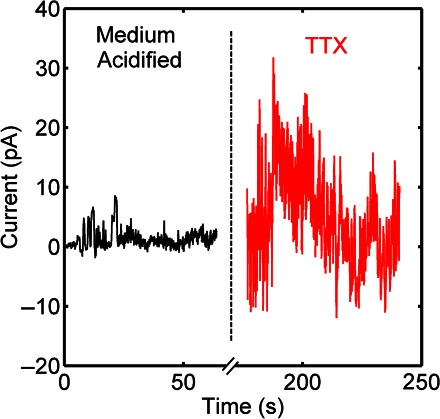
Fig. 4. Time evolution of current noise of C6 glioma cells upon adding TTX.

The black trace on the left depicts the noise of acidified cells. The red trace on the right depicts the noise measured immediately after adding TTX to the acidified cell culture medium with a concentration of 1 μM.
