
Fig. 4. Syrosingopine strongly potentiates the effect of mitochondrial inhibitors.
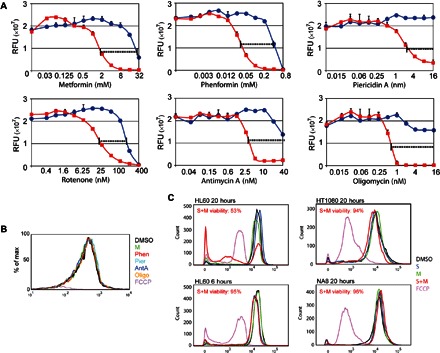
(A) HL60 cells treated with increasing amounts of various mitochondrial inhibitors in the absence (blue lines) or presence of 5 μM syrosingopine (red lines). (B) Determination of mitochondrial membrane potential with TMRM staining. HL60 cells were treated for 20 hours with the following compounds: 5 mM metformin, 100 μM phenformin (Phen), 8 nM piericidin A (Pier), 5 nM antimycin A (AntA), 1 nM oligomycin (Oligo), 10 μM FCCP (positive control), and 5 μM syrosingopine. (C) Mitochondrial membrane potential of cells treated with the indicated drugs for the indicated length of time measured by TMRM staining. Viability of syrosingopine-metformin–treated cells was measured by trypan blue staining, followed by automated cell counting.