. 2016 Dec 23;5:e19238. doi: 10.7554/eLife.19238

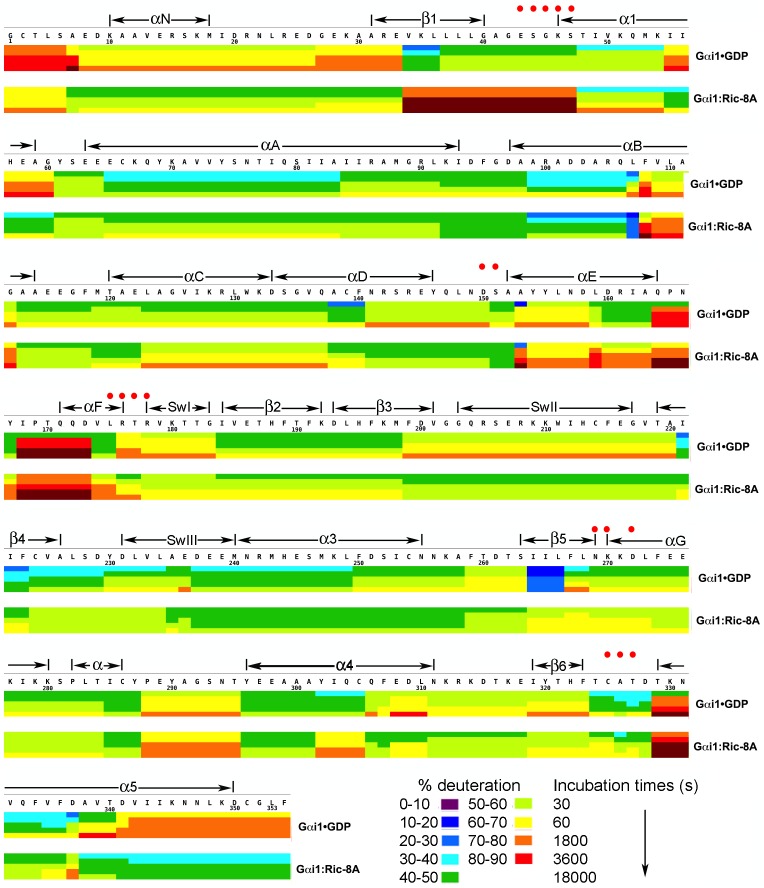
Figure 1. Kinetics of Hydrogen-Deuterium exchange from Gαi1 in complexes with GDP and Ric-8A.

HDX at successive time points are represented by sets of horizontal bars, progressing from top (30 s) to bottom (5 hr), mapped on the amino acid sequence of Gαi1 for Gαi1•GDP (upper set) and Gαi1:Ric-8A (lower set). Color coding (see key) indicates fraction (percent) of total amide hydrogen atoms exchanged per peptide at each time point. Location of secondary structure elements is shown above the amino acid sequence. Red dots indicate residues that form non-covalent interactions with GDP.

DOI: http://dx.doi.org/10.7554/eLife.19238.003

Figure 1—source data 1. Percent deuteration of peptides derived from Gαi1•GDP and Gαi1:Ric-8A.
DOI: 10.7554/eLife.19238.004

Figure 1.

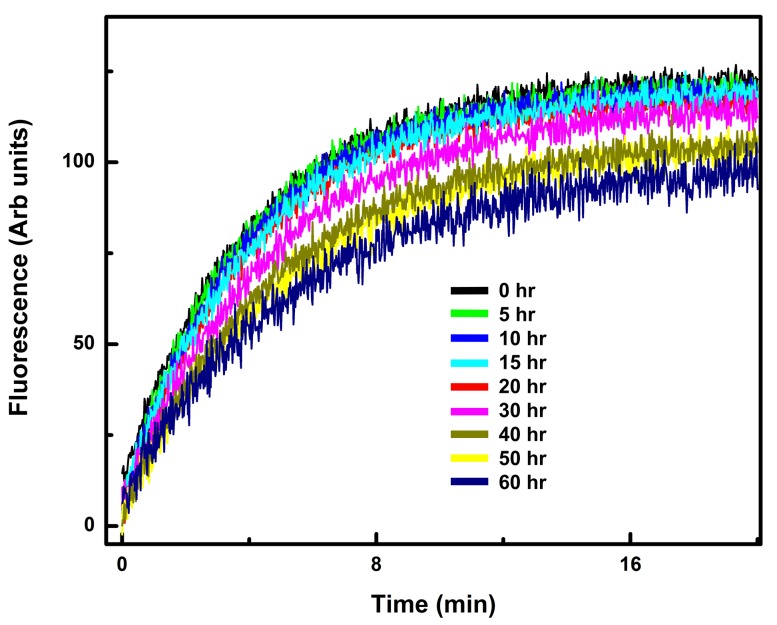
Figure 1—figure supplement 1. The Gαi1:Ric-8A complex is stable over the period in which the HDX experiments were performed.

Figure 1—figure supplement 1.

The increase in tryptophan fluorescence emission upon addition of GTPγS at successive time points was measured after Ric-8A:Gαi1 (0.5 µM) in 20 mM HEPES, pH 8.0, 100 mM NaCl, 10 mM MgCl2, 1 mM DTT, and 0.05% C12E10 in a reaction volume of 400 µl was allowed to equilibrate for 10–15 min at 20°C in a quartz fluorescence cuvette. GTPγS (final concentration, 5 µM) was added to the reaction mixture, and the increase in fluorescence at 340 nm was monitored upon excitation at 290 nm as described in Materials and methods.