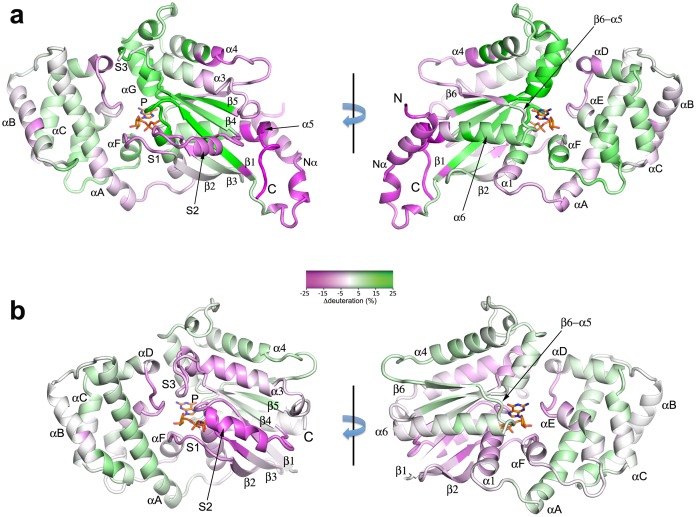
Figure 4. Binding of Ric-8A to Gαi1, and nucleotide exchange induce widespread changes in Gα secondary structure.
(a) in the transition from Gαi1•GDP to Gαi1:Ric-8A-bound states, and (b) Gαi1•GDP to GTPγS complexes, as revealed by HDX-MS. The color scheme represents difference in per-residue deuteration relative to Gαi1•GDP mapped onto the structures of Gα•GDP (A, PDB 1GGD) or Gαi1•GTPγS (PDB 1GIT) Residues that undergo an increase in deuteration of 25% or greater are colored green (deprotection), and those that experience a decrease in deuteration of 25% or less are colored magenta (protection). Intermediate degrees of deuteration changes are colored according to the color key. Secondary structure elements are labeled; Switch I, Switch II and Switch III are labeled as S1, S2 and S3, respectively. Bound nucleotide, which is not present in the Gαi1:Ric-8A complex, is shown as a stick figure.

