Figure 6. Transposable element landscape.
(A) Proportion of DNA annotated as TEs (black) or unannotated (white) using RepeatMasker (Smit et al., 2015) and a custom putative TE library (see text). MAC putative TE content is about 1 Mb, potentially corresponding to a mixture of TE sequences retained in the MAC assembly and repeats not corresponding to TEs still in the library. (B) Proportion of putative TEs by class for MIC (ALL and high-confidence IESs) and MAC. In MIC(ALL), the most abundant elements (besides unclassified) correspond to DNA TEs (‘cut-and-paste’, Mavericks and Tlr elements). More than half of the MIC(ALL) non-LTR elements could be annotated as LINE1 elements. (C) Evolutionary view of putative TEs in the MIC. For each class, amounts of DNA are shown as a function of the percentage of divergence to the consensus (by bins of 1%), as a proxy for age: the older the TE invasion, the more copies will have accumulated mutations (higher percentage of divergence, right of the graph). Conversely, sequences corresponding to youngest elements show little divergence (left of the graph).
DOI: http://dx.doi.org/10.7554/eLife.19090.017
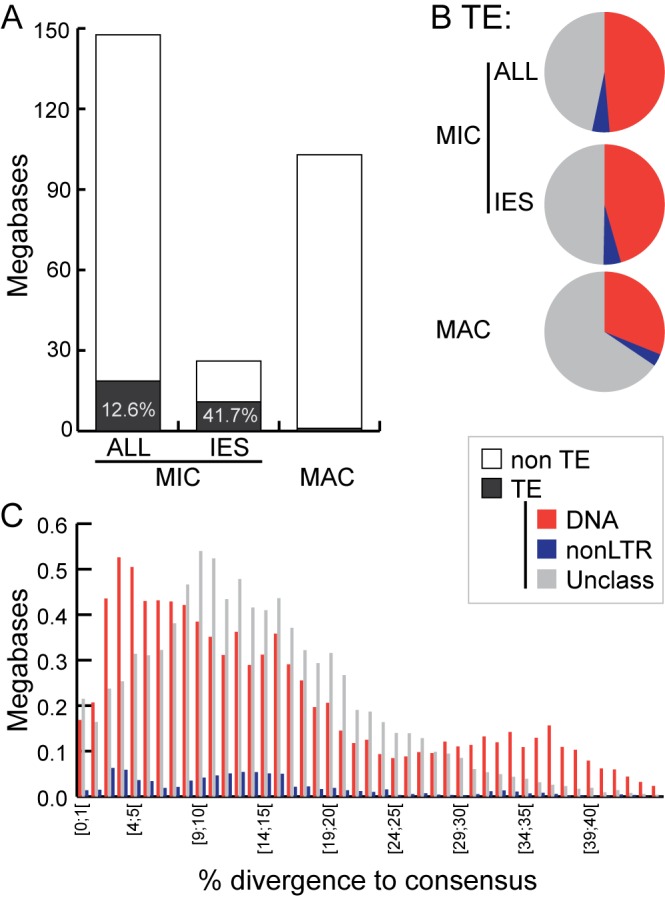
Figure 6—figure supplement 1. MAC retention of TE termini.

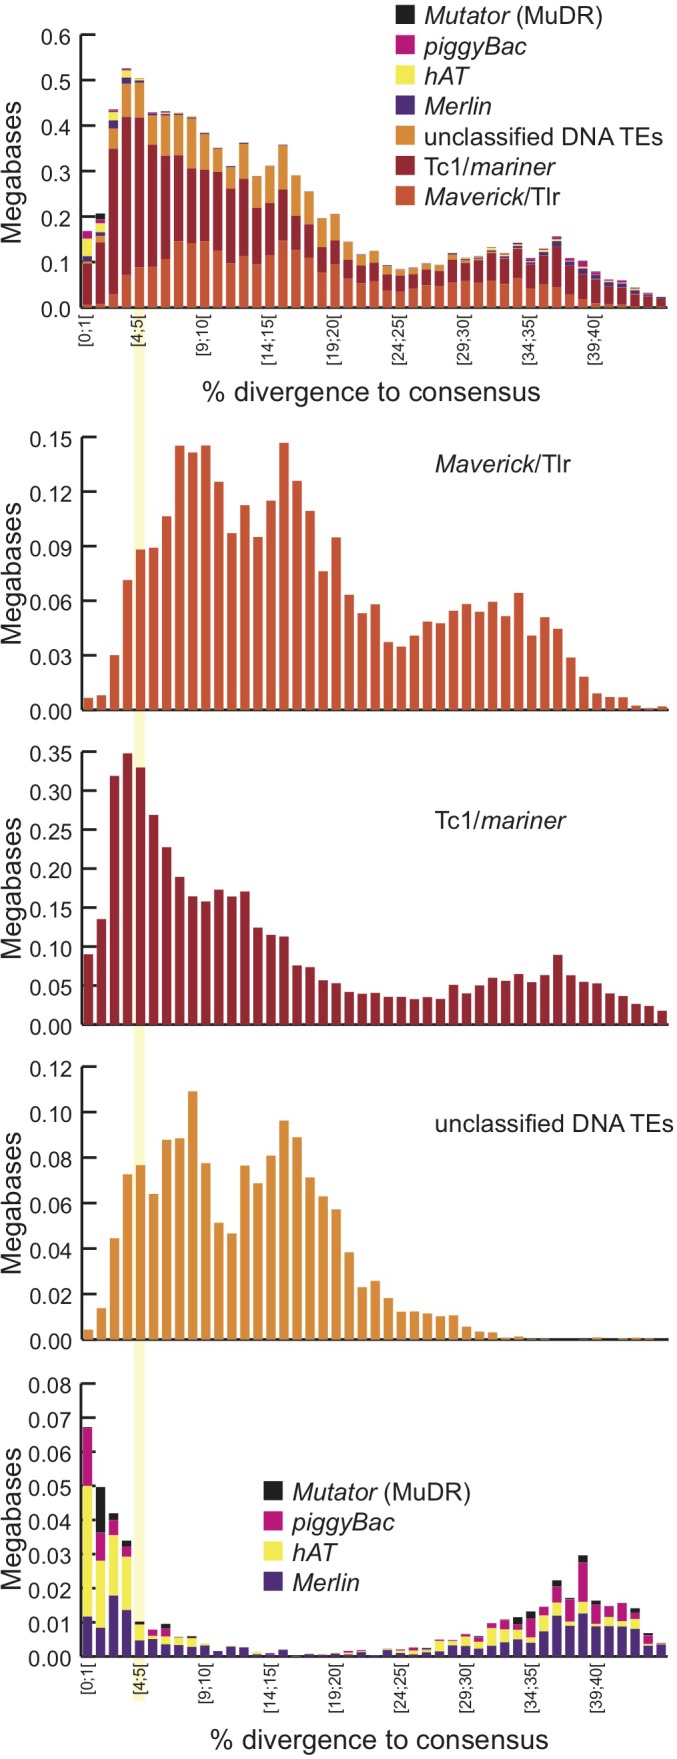
Figure 6—figure supplement 2. Landscape details of DNA TEs.