. 2016 Dec 23;5:e20640. doi: 10.7554/eLife.20640

Figure 4. The ZitP•PopZ complex controls the C.

crescentus cell division cycle. (A) Overlays of mCherry-fluorescence and phase contrast images of WT (upper panels) or ΔzitP (bottom) C. crescentus expressing the mCherry-PopZKE variant that no longer interacts with ParB. mCherry-PopZKE is expressed from the native locus (mCherry-popZKE) in lieu of untagged PopZ. Below the micrographs are quantifications of cells with and without bipolar or monopolar fluorescent foci of mCherry-PopZKE. (B) Efficiency of plating (EOP) assays of C. crescentus strains expressing WT mCherry-PopZ (mCherry-popZ) or variants that no longer interact with ParB (mCherry-popZKE), with ParA (mCherry-popZSP) or both (mCherry-popZKEP and mCherry-popZΔ26) in WT or ΔzitP cells. Serial ten-fold dilutions were plated on PYE agar containing spectinomycin. (C) Growth measurements of various strains monitored by optical density at 660 nm (OD660) in PYE. (D) Overlays of CFP- and mCherry-fluorescence with phase contrast images from C. crescentus popZ::mCherry-popZ parB::CFP-parB cells harbouring an empty plasmid (pMT464, left panel) or the pPxyl-ZitP1-133(WT) derivative followed by time-lapse analysis with images acquired every 40 min. (E) Overlays of mCherry-fluorescence with phase contrast images from C. crescentus popZ::mCherry-popZ parB::CFP-parB cells harbouring an empty plasmid (pMT464, left panel) or derivatives: pPxyl-ZitP1-133(WT) (second panel), pPxyl-ZitP1-133(CS) (third panel), pPxyl-ZitP1-133(W35I) (fourth panel) and pPxyl-ZitP1-133(R24A/R27A) (right panel). Overexpression of ZitP1-133 variants was induced with xylose 0.3% for 6 hr prior to imaging. (F) Overlays of mCherry-fluorescence with phase contrast images from C. crescentus popZ::mCherry-popZ parB::CFP-parB cells harbouring a Pxyl-ZitP1-133(MalF-TM), Pxyl-ZitP1-133(WT) or a Pxyl-ZitP1-90 overexpression plasmid. Overexpression was induced by growth in 0.3% xylose for 6 hr prior to imaging. (G) Overlays of mCherry-fluorescence with phase contrast images from C. crescentus popZ::mCherry-popZKEP parB::CFP-parB cells harbouring a Pxyl-ZitP1-133(WT) or a Pxyl-ZitP1-133(W35I) overexpression plasmid. Overexpression was induced by growth in 0.3% xylose for 6 hr prior to imaging.

DOI: http://dx.doi.org/10.7554/eLife.20640.008

Figure 4.

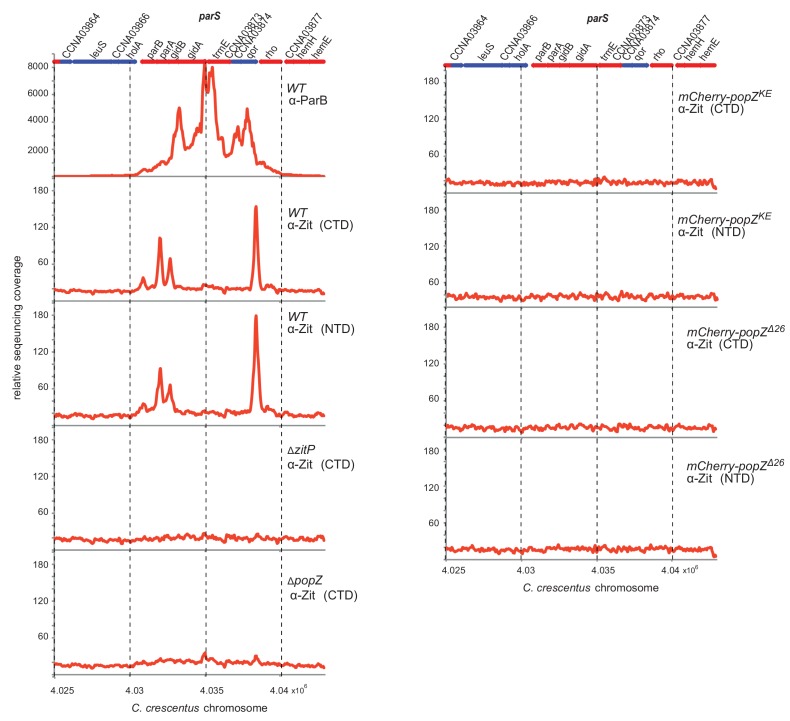
Figure 4—figure supplement 1. ChIP-Seq analysis of ZitP.

Figure 4—figure supplement 1.

Genome-wide occupancies of ParB in WT cells and ZitP in WT, ΔzitP and popZ mutant cells as determined by ChIP-Seq using antibodies to ParB (α-ParB) and different antibodies to (the N-terminal and C-terminal domains of) ZitP [α-ZitP(NTD) and α-ZitP(CTD), respectively]. The x axis denotes the nucleotide position on the genome, whereas the y axis denotes the relative abundance of reads for each probe (see Supplementary Methods for detailed description). Note that only the region from nucleotide 4,025,000 to 4,045,000 of the C. crescentus WT (NA1000) genome containing the parS centromere region is shown. Genes encoded from right to left are shown as blue bars, whereas the red bars indicate genes on the reverse strand. The numbers above the coding sequences refer to the CCNA gene annotation (Marks et al., 2010).
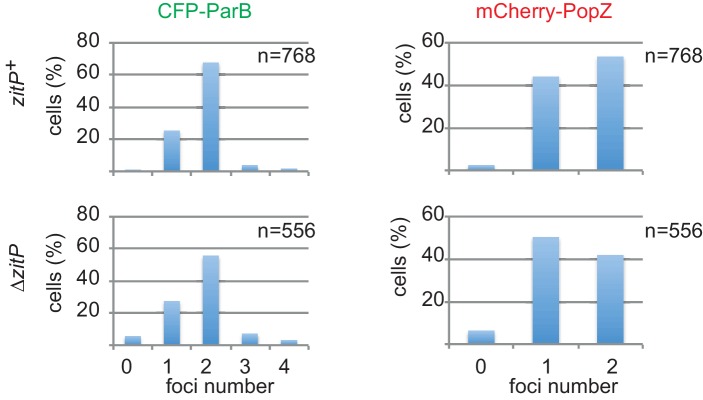
Figure 4—figure supplement 2. Quantification of polar CFP-ParB and mCherry-PopZ in C.crescentus WT and mutants.

Figure 4—figure supplement 2.

Quantification of CFP-ParB and mCherry-PopZ localization in zitP+ or ΔzitP strains expressing CFP-ParB in lieu of untagged ParB from the parB locus and mCherry-PopZ from the popZ locus in lieu of native PopZ.
Figure 4—figure supplement 3. Localization of ParB and ParA upon ZitP1-133 overexpression in C.crescentus.

Figure 4—figure supplement 3.

(A) Kymograph showing GFP-ParB localization along the C. crescentus cell cycle in WT or ZitP1-133 overproduction. Swarmer (G1-phase) cells harbouring an empty plasmid or overexpressing ZitP1-133(WT) were cultivated in M2G before synchronization and transferred onto an agarose pad containing 0.3% xylose (t = 0 min) to induce ZitP1-133, and visualized at 20 min intervals by light and fluorescence microscopy, respectively. Images were analysed using the kymograph tool from Microbe tracker. One representative cell from the parB::GFP-parB strain harbouring the empty plasmid is shown as well as two representative cells from the parB::GFP-parB strain overexpressing ZitP1-133. Green arrowheads indicate the localization of GFP-ParB according to the cell length. (B) Images of C. crescentus harbouring an empty plasmid (pMT464, top panel), pPxyl-ZitP1-133(WT) (middle panel), pPxyl-ZitP1-133(CS) (bottom panel) and expressing from the chromosomal xylX locus a ParAG16V-eYFP (dimerization deficient mutant which localize preferentially at the cell pole rather than nucleoid)(Ptacin et al., 2010). ZitP1-133 over-expression was induced by growth in xylose 0.3% for 6 hr prior to imaging. Overlays between phase contrast and YFP-fluorescence images are shown. (C) Immunoblot showing the steady-state levels of C. crescentus ZitP or ZitP derivatives expressed from Pxyl on pMT464 in C. crescentus WT cells. WT harbouring empty pMT464 was used as a control. The blot was probed with the polyclonal antibody to the ZitP N-terminal domain (NTD). Note that endogenous ZitP expressed form the zitP locus is not detectable on this exposure due to the strong overproduction of the ZitP variants from the high copy plasmid.