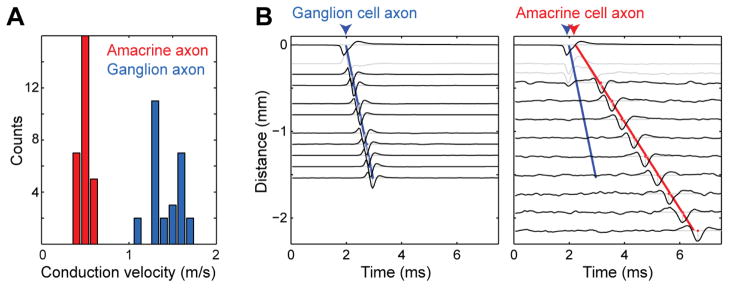
Figure 3.
Spike conduction velocity of PAC axons was much slower than that of the ON parasol axon. A. Distribution of conduction velocities of ON parasol cell axons and PAC axons in a single recording (28 cells). Mean:1.5m/s +−0.2 SD, 0.5m/s +−0.1 SD respectively. B. Voltage waveforms from electrodes obtained at different distances from the soma along the ON parasol cell and PAC axon. Time of spike initiation at the soma was linearly extrapolated toward zero from axon spike times (ON parasol axon blue line, PAC axon red), resulting in an estimated delay between ON parasol and PAC spike initiation. Dendritic waveforms were not used and are indicated in light gray. Waveform amplitudes are normalized.

