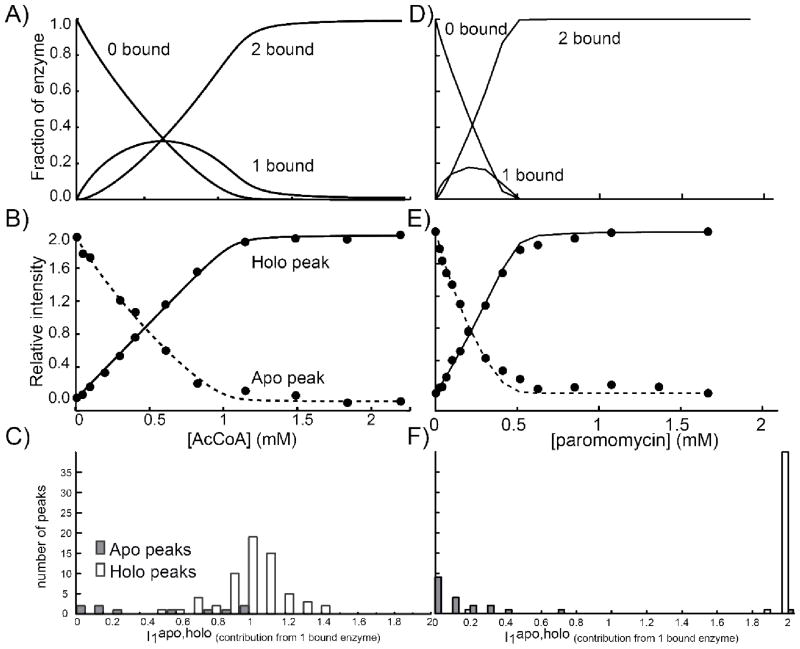
Figure 12.
Joint NMR/ITC analysis of AAC(6′)-Ii binding to AcCoa (A-C) and paromomycin (D-E). Fraction of enzyme in the 0-bound, 1 bound and 2 bound states determined by ITC (A,D). Intensities of a representative apo peak (dashed line) and holo peak (solid line) throughout a titration (B, E). Histograms of the relative contributions of the 1 bound state to apo (I1apo) and holo (I1holo) peaks of AAC(6′)-Ii (C,F).

