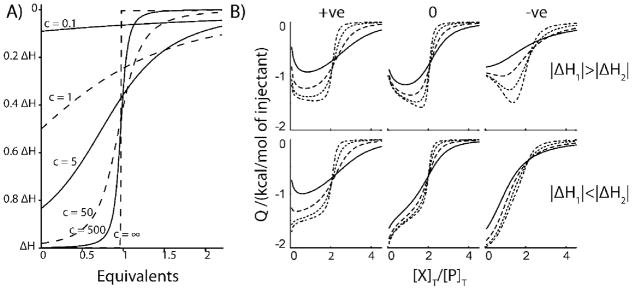
Figure 3.
A) Theoretical ITC isotherms generated with different c-values for a single-set of equivalent sites model. B) Theoretical ITC isotherms generated according to a 2-site cooperative model, with [P]T = 0.5, 1.5, 4.5, 13.5 μM for the solid, dashed, dotted, and dash-dotted lines respectively. In B) left-most panels show positively-cooperative, and right-most panels show negatively-cooperative datasets. Centre panels correspond to systems where both ligands bind with equal affinities, but with different enthalpies. The top panels, |ΔH2|>|ΔHi|. In the bottom panels, |ΔH2|<|ΔHi|. Values of KA1 (×105 M), KA2 (×105 M), ΔH1(kcal/mol), ΔH2(kcal/mol) employed are: upper-left) 1,10,-1,-2; upper-centre) 1,1,-1,-2; upper-right)10,1,-1,-2; lower-left)1,10,-2,-1; lower-centre)1,1,-2,-1; lower-right)10,1,-2,-1. These correspond to c-values ranging from 0.05 to 13.5. Adapted from Freiburger et al [22].

