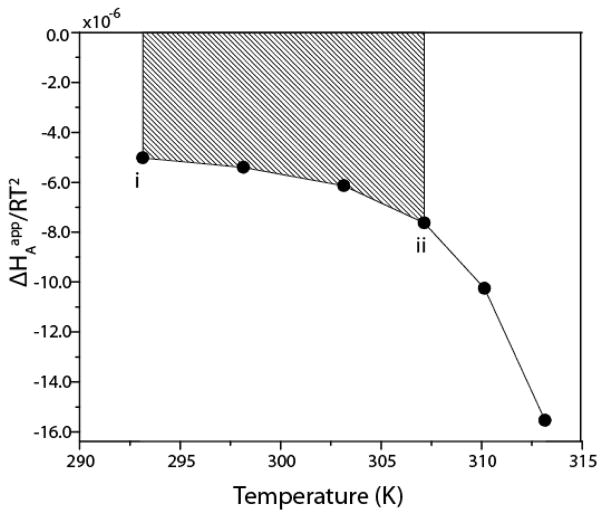
Figure 6.
Schematic representation of trapezoidal integration of ΔHAapp/RT2. The points represent the fitted values of ΔHAapp, divided by the corresponding values of RT2. The difference in binding affinity between temperatures Ti and Tii corresponds to the shaded area, i.e. KAapp(ii) = KAapp(i) + shaded area. Thus the ΔHAapp/RT2 profile together with the single value of KAapp(i) specifies the affinity constants at all other temperatures. Adapted from Freiburger et al [30].

