
Fig. 3. Overview of signals.
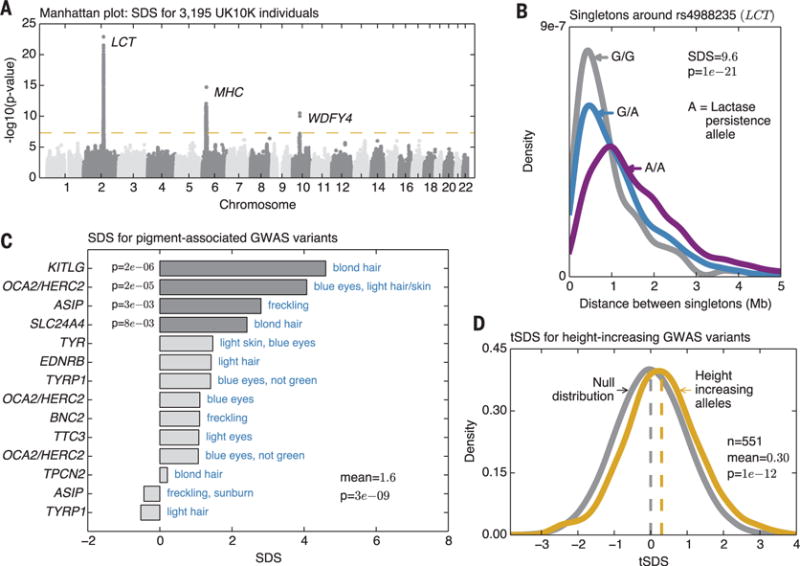
(A) Manhattan plot of SDS P values indicates regions of genome-wide significance (P < 5 × 10⁻⁸; P values are two-sided tail probabilities of standard normal). (B) Distributions of singleton distances at the lactase locus, partitioned by genotypes at the causal site. Compare to simulated signals (Fig. 1E). (C) SDS signals for a curated set of segregating variants with known effects on pigmentation shows overall increase in derived allele frequencies (one-sided P values). (D) Distribution of tSDS scores at 551 height-associated SNPs. tSDS is polarized so that tSDS > 0 implies increased frequency of the “tall” allele.