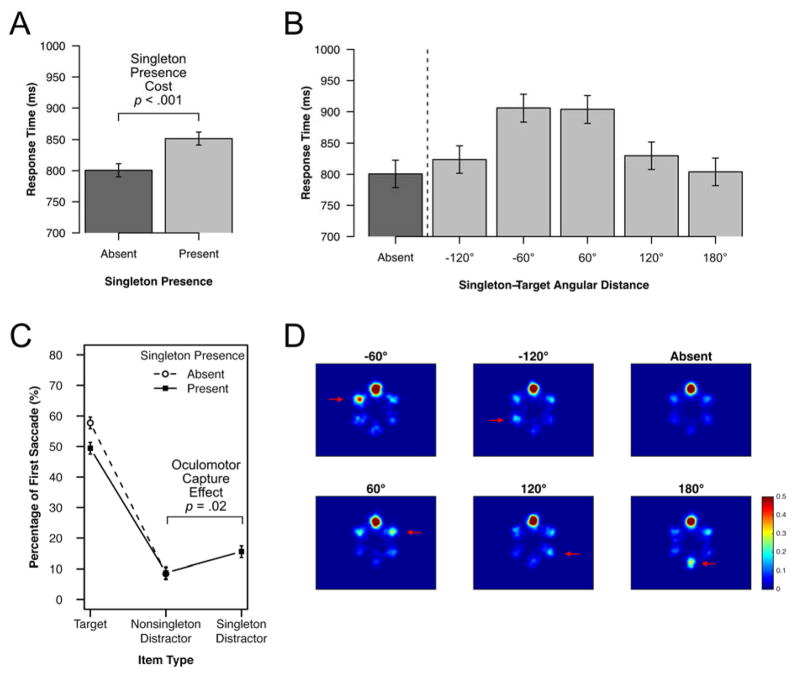
Figure 2.
Results from Experiment 1. (A) Manual response time as a function of singleton presence. (B) Manual response times as a function of the angular distance between the irrelevant singleton and the target. (C) Percentage of first saccades that landed on a given stimulus type (target, nonsingleton distractor, or singleton) on trials with and without a color singleton. For the nonsingleton distractors, this is the mean per distractor, not the mean summed across the several distractors. (D) Heat maps of first-saccade landing position for each singleton position relative to the target location. The data from each trial have been rotated as if the top location contained the target. Red arrows point to the singleton location. All heat maps were generated using a Gaussian filter with a smoothing kernel of 0.3° of visual angle. All error bars shown here and in subsequent figures represent within-subject 95% confidence intervals (Masson & Loftus, 1994).

