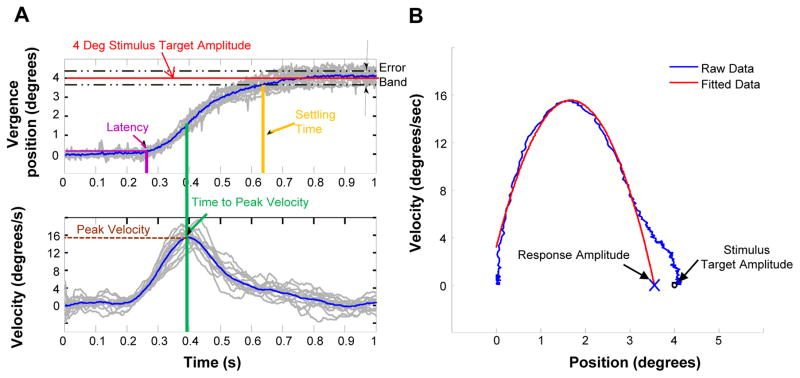
Figure 2.
Data analysis of objective eye movements. (A) The temporal properties where the position is plotted as a function of time (upper) and the velocity is plotted as a function of time (lower). (B) The phase plane, which is a plot of velocity as a function of position to calculate the accuracy of the movement.

