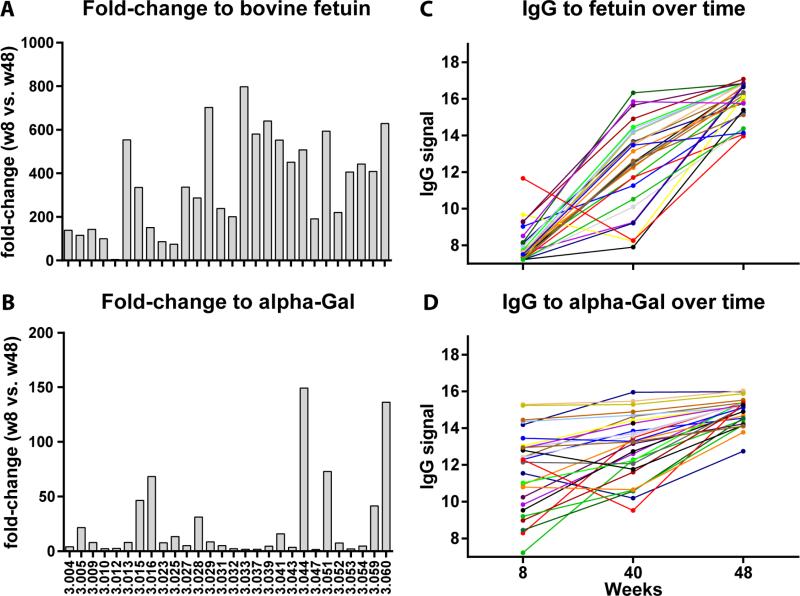
Figure 2.
IgG responses to bovine fetuin and alpha-Gal antigens. The fold-changes to bovine fetuin and alpha-Gal at week 48 (relative to baseline) in individual patients were shown in panels A and B, respectively. Panels C and D represented IgG responses overtime. Each line traces a patient at three time points: week 8 (baseline), week 40 (after 1 vaccine) and week 48 (after 3 vaccines). IgG signals are in Log2 scale.

