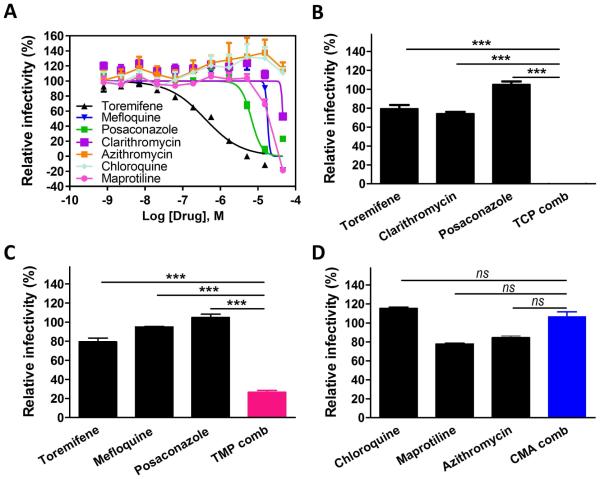
Fig. 2. Synergistic inhibition of infection of Ebola live virus in Vero E6 cells by three-drug combinations.
(A) Confirmatory dose-response curves of toremifene (dark line), mefloquine (blue line), posaconazole (green line), and clarithromycin (purple line) in inhibiting EBOV in Vero E6 cells using eGFP-EBOV assay. (B-D) Synergistic inhibition of EBOV infection by three-drug combination: TCP (0.15 μM toremifene, 2 μ M clarithromycin and 4 μM posaconazole), TMP (0.15 μM toremifene, 2 μM mefloquine and 4 μM posaconazole), and CMA (2 μ M chloroquine, 1 μM maprotiline and 1 μM azithromycin). All experiments were performed in triplicate and data are representative of at least two independent experiments. Data are represented as mean±s.e.m. For B, C and D, ***P ≤ 0.001. ns = difference is not statistically significant. P value indicates that the statistical significance was measured by Student’s t-test.

