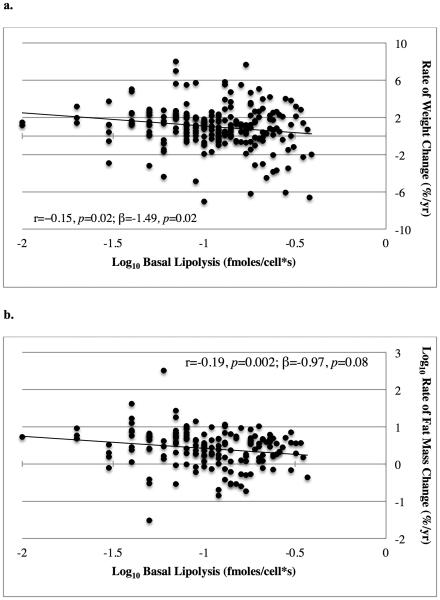
Figure 3. Association Between In Vitro Lipolysis and Weight Gain.
The association between basal lipolysis per cell with rate of percent weight change (a.) and rate of percent fat mass change (b.) Lipolysis values and rate of percent fat mass change are shown on logarithmic scales. Unadjusted Pearson product-moment correlations (r) and adjusted parameter estimates (β) are reported with their associated p values.

