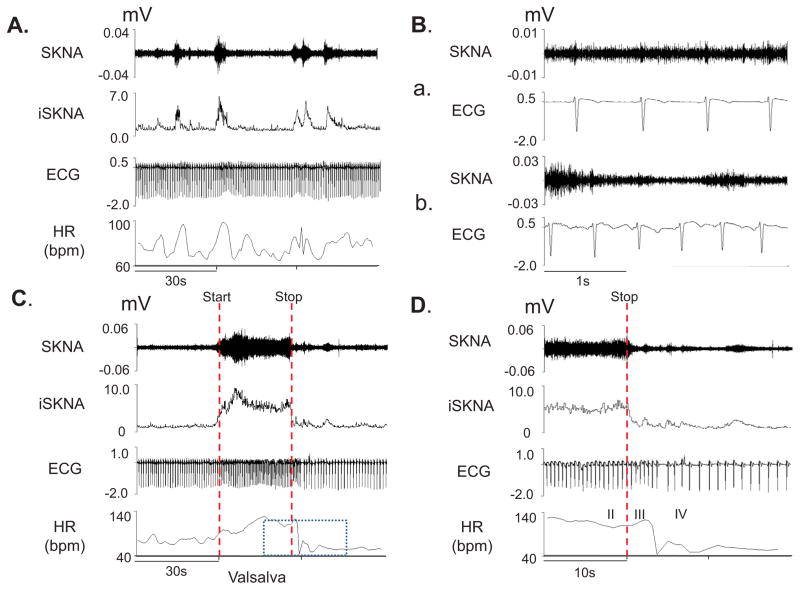
Figure 1.
neuECG recordings from subject 12 of Protocol 1. Signals from Lead V1 were bandpass filtered between 500 Hz and 1000 Hz to detect SKNA and bandpass filtered between 0.5 Hz and 150 Hz to detect ECG. Integrated SKNA (iSKNA) was calculated over 100 ms window. A: Increased SKNA was associated with heart rate (HR) acceleration. B: Higher magnification of SKNA showing baseline spontaneous nerve activities (a) and large variations of nerve discharges associated with tachycardia (b). C: increased SKNA and HR were evident during Valsalva maneuver (VM); dotted red lines mark the start and the stop of the maneuver. D shows the magnified boxed segment from C, showing phases II–IV of the VM and demonstrating that the SKNA is not synchronous with the QRS complex.

