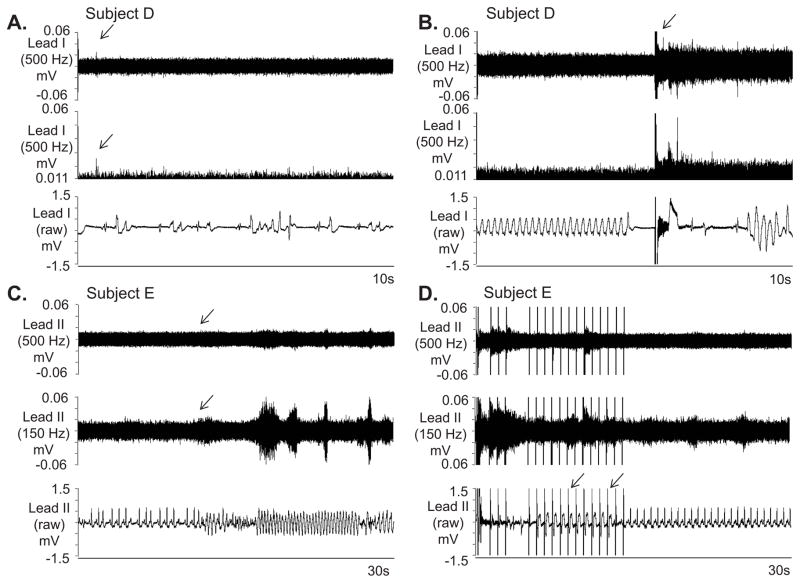
Figure 5.
Further examples of SKNA and VT. A: Increased nerve activity, including a large spike (arrow) is noted in lead I in a intubated and sedated patient with electrical storm after 500 Hz high pass filtering. The signal is better appreciated in the middle panel after rectification and baseline adjustment. The simultaneous raw electrocardiogram (ECG) is displayed in the bottom panel and shows both premature ventircular contractions and a brief run of polymorphic VT. B displays similar simultaneous recordings in the same patient during sustained VT requiring external defibrillation (arrow, top panel). The defibrillation was followed immediately by large SKNA. The shock was only transiently successful, followed by recurrences of VT. Recordings from C and D are from another patient with VT and are continuous. In this recording after high pass filtering, the signal to noise ratio of SKNA prior to VT in C, top and middle panel does not reach 2:1. High pass filtering at 150 Hz again improves the signal to noise ratio (downward arrows, C). However as the arrhythmia continues in D and the patient’s device delivers successful burst of anti-tachycardia pacing (downward arrows, bottom panel), incraesed SKNA is detected both with 500 Hz high pass filter and 150 Hz high pass filter. VT=ventricular tachycardia, ECG=electrocardiogram, SKNA=skin sympathetic nerve activity.

