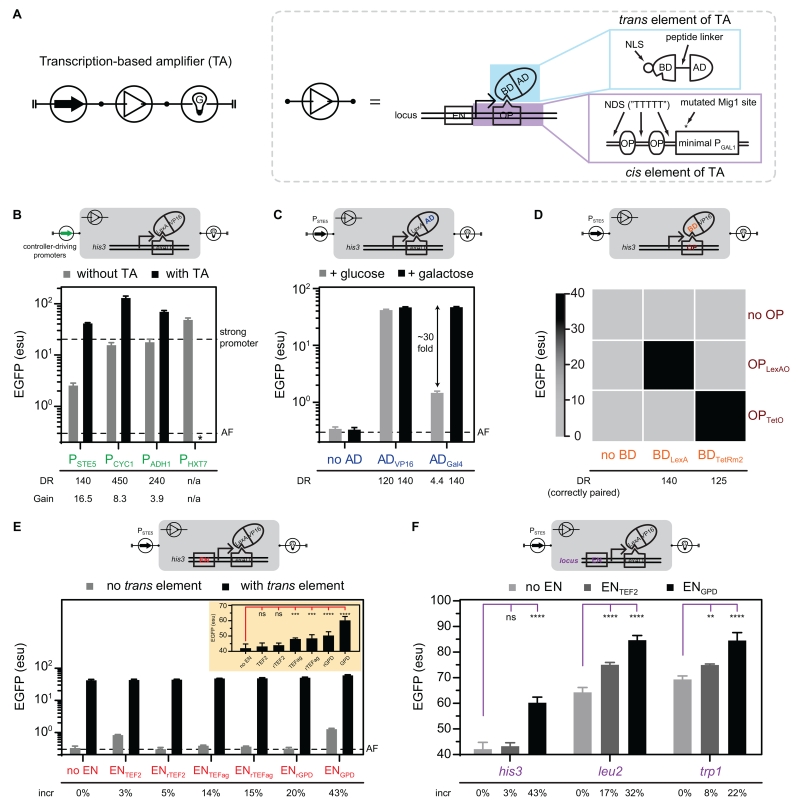
Figure 2. Design and optimization of the transcription-based amplifier.
(A) Circuit symbol (left) and compositional domains of a transcription-based amplifier (dash box). The trans element of the amplifier has (blue box) a nuclear localization signal (NLS), a DNA-binding domain (BD), a peptide linker, and an activation domain (AD). The cis element of the amplifier has (purple box) an upstream epigenetic enhancer (EN), two operator (OP) sites interspaced with nucleosome-disfavoring sequences (NDSs), and a minimal promoter from PGAL1 with mutated Mig1 site.
(B) Gain and dynamic range of the transcription-based amplifier under different controller-driving promoters. Both “with amplifier” (amplifier regulating EGFP) and “without amplifier” (controller-driving promoter directly regulating EGFP) were characterized. Bars represent mean values and error bars represent ± 1 s.d. of three biological replicates. The amplification gain (Gain) and dynamic range (DR) are displayed. Two dashed lines represent the expression levels of PTEF1 integrated at his3, and empty strain as the autofluorescence level (“AF”; CSY3). *No viable cells were observed when transforming the PHXT7-driven amplifier into yeast, which can be due to growth inhibition under excessive expression of the trans element of the amplifier. See also Figure S1A.
(C) Examination of the AD modularity by extending the BDLexA-based transcription-based amplifier to different ADs (ADVP16 or ADGal4). The constructs were characterized as Figure 2B, except two carbon sources (glucose or galactose) were supplied in the media. Bars represent mean values and error bars represent ± 1 s.d. of three biological replicates, and the dynamic range is displayed. See also Figure S1C.
(D) Examination of the BD modularity and orthogonality by extending the transcription-based amplifier to two trans elements (BDLexA and BDTetRm2) and their cognate cis elements. The constructs were characterized as Figure 2B. Mean values of three biological replicates for each construct are represented in the heat map, and the dynamic range is displayed only for the construct on the diagonal (correctly paired). See also Figures S1D and S2.
(E) The impact of EN on gene expression levels. Three ENs (ENGPD, ENTEF2, and ENTEFag) were inserted upstream of the cis element (CSY1101) of the BDLexA-based amplifier, in either native or reverse orientations. Either an empty plasmid (no trans element) or a trans element-harboring plasmid (with trans element) was transformed into the strains with EN-modulated cis reporters, and characterized as Figure 2B. Bars represent mean values and error bars represent ± 1 s.d. of three biological replicates, and the percentage increase in EGFP levels (“incr”; setting no EN to 0%) is displayed. The yellow inset illustrates the result of “with trans element” in linear scale for better visualization. ANOVA test was performed with an ad hoc Dunnett’s test. See also Figure S1E.
(F) Examination of EN modularity at distinct genomic loci. The EN-modulated cis reporters were integrated into three loci (his3, leu2, and trp1), and were characterized as Figure 2B. The y-axis is in linear scale for better visualization. Bars represent mean values and error bars represent ± 1 s.d. of three biological replicates, and the percentage increase in EGFP levels (“incr”; setting no EN in each locus to 0%) is displayed. ANOVA test was performed with an ad hoc Dunnett’s test.
Significance summary: p > 0.05 (ns), p ≤ 0.05 (*), p ≤ 0.01 (**), p ≤ 0.001 (***), and p ≤ 0.0001 (****).

