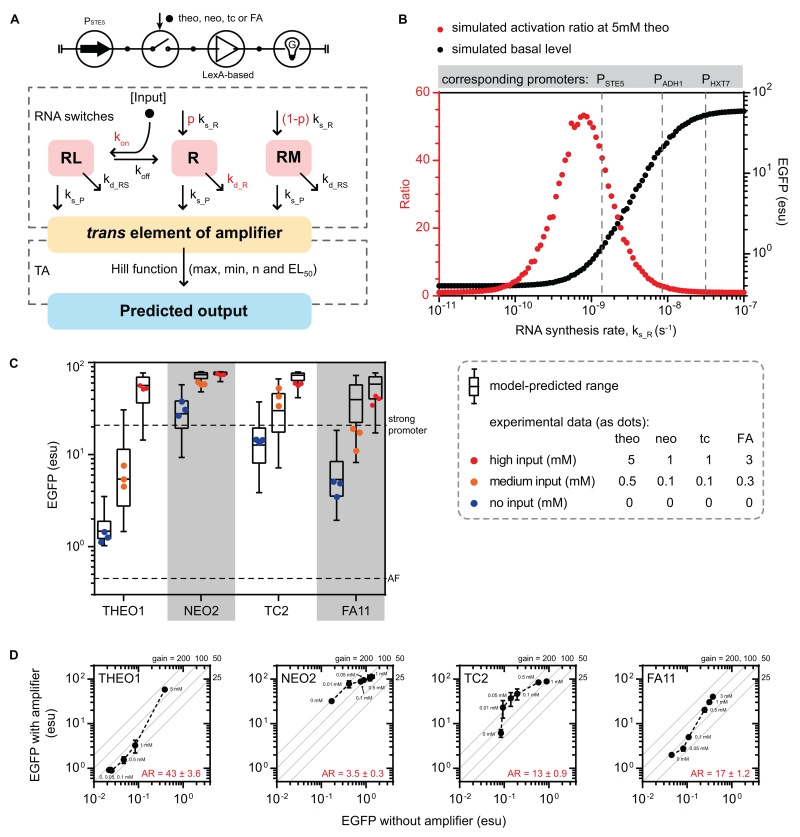
Figure 3. A model-guided approach to facilitate the design of the EGFP-activator.
(A) Circuit symbol (top) and in silico model (bottom) of the EGFP-activator. The model of the EGFP-activator comprises of an RNA switch model (first dashed box) with a transcription-based amplifier model (second dashed box). See also STAR Methods for modeling details.
(B) Applying the modeling procedure to facilitate the level-matching process between stages. The performance metrics of the modeled controller (THEO1-BDLexA-based EGFP-activator) was evaluated under a range of RNA synthesis rate (ks_R from 10−11 to 10−7 Ms−1). The median values (Monte Carlo, N = 1000) of the simulated activation ratio (red) and basal level (black) are plotted. Three in vivo characterized conditions (PSTE5, PADH1, and PHXT7) are displayed as dashed lines. See also Figure S3A.
(C) Comparison of the predicted and experimentally measured performance of the EGFP-activators. The modeling procedure (Monte Carlo, N = 5000; ks_R = 10−9 s−1) was applied to four EGFP-activators (with RNA switches THEO1, NEO2, TC2, and FA11). The predicted range of EGFP is represented as a box-and-whisker plot (bars representing: min, first quartile, median, third quartile, and max). EGFP level was measured after growing cells with added inputs for 6 hours, and is plotted against the predicted expression range (dots as individual replicates).
(D) Amplification gains exhibited by the EGFP-activators. For each EGFP-activator (“with amplifier”), a corresponding construct was built using the RNA switch to directly regulate EGFP expression (without amplifier). The constructs were characterized as Figure 3C. Each dot represents an input level (with the concentration labeled alongside), and error bars represent ± 1 s.d. of three biological replicates. Diagonal lines represent the levels of constant gain. See also Figure S3B.
Abbreviations: AR: activation ratio. In the RNA switch model - R, RL and RM: cleavable, input-bound non-cleavable, and misfolded non-cleavable RNA switch states in an mRNA; ks_R, and ks_P: synthesis rates of mRNA and protein; kd_R, kd_RS, and kd_P: degradation rates cleavable RNA, non-cleavable RNA, and protein; p: mRNA folding partition coefficient; kon and koff: input-aptamer binding constants. In the amplifier model - max: saturation level; min: leakage level; n: cooperativity; EL50: half-maximal response.

